The hdatools package provides a set of functions and tools for data analysis and visualization.
Installation
# install.packages("devtools")
devtools::install_github("hdadvisors/hdatools")
Features
Themes
-
theme_hda(): HDAdvisors-branded ggplot2 theme -
theme_hfv(): HousingForward Virginia-branded ggplot2 theme -
theme_pha(): PHA-branded ggplot2 theme
Color Scales
-
scale_color_hda(),scale_fill_hda(): HDA-branded discrete color scales -
scale_color_hfv(),scale_fill_hfv(): HFV-branded discrete color scales -
scale_color_pha(),scale_fill_pha(): PHA-branded discrete color scales -
scale_color_gradient_hda(): HDA-branded continuous color scale -
scale_color_gradient_pha(),scale_fill_gradient_pha(): PHA-branded continuous color scales
Utility Functions
-
add_reliability(): Add reliability labels based on coefficient of variation -
fct_case_when(): Create a factor with case_when logic and automatic level ordering -
markdown_wrap_gen(): Generate a function to wrap and format facet labels with markdown -
add_zero_line(): Add darker line to zero intercept -
publish_plot(): Create dynamic graphic from plot object when document rendered as HTML
Usage
Basic example:
library(hdatools)
library(tidyverse)
# Create a sample dataset
data <- data.frame(
x = as.character(c(1:8)),
y = runif(8, 0, 100),
group = rep(c("A", "B"), each = 4)
)
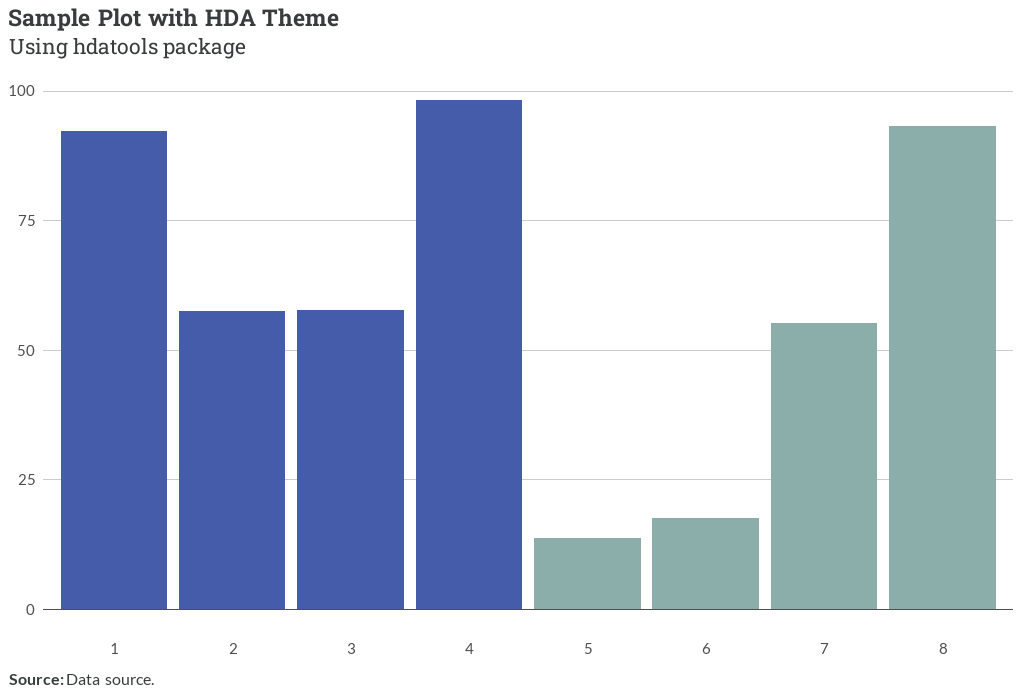
# Create a plot with HDA theme and colors
ggplot(data, aes(x, y, fill = group)) +
geom_col(position = "dodge") +
scale_fill_hda() +
add_zero_line() +
theme_hda() +
labs(title = "Sample Plot with HDA Theme",
subtitle = "Using *hdatools* package",
caption = "**Source:** Data source.")
# Add reliability labels to a dataset
data_with_reliability <- data |>
mutate(cv = runif(10, 0, 0.5)) |>
add_reliability()
# Create a factor with custom ordering
data_with_factor <- data |>
mutate(factor_col = fct_case_when(
x < 3 ~ "Low",
x < 7 ~ "Medium",
TRUE ~ "High"
))