2 Core workforce spectrum
This chapter assesses the housing spectrum for the region’s core workforce. This includes all households where at least one member is employed at a job also located within the region.
Defining the “core workforce”
For every record of an employed person, the Public Use Microdata Sample (PUMS) includes a variable for the place-of-work Public Use Microdata Area (“POWPUMA”). Households with at least one person who has worked in the last 12 months and whose POWPUMA values correspond to the Fredericksburg area (Planning District 16) were designated as members of the core workforce.
Employed persons who work from home are included in this group.
2.1 Overview
Identifying the core workforce
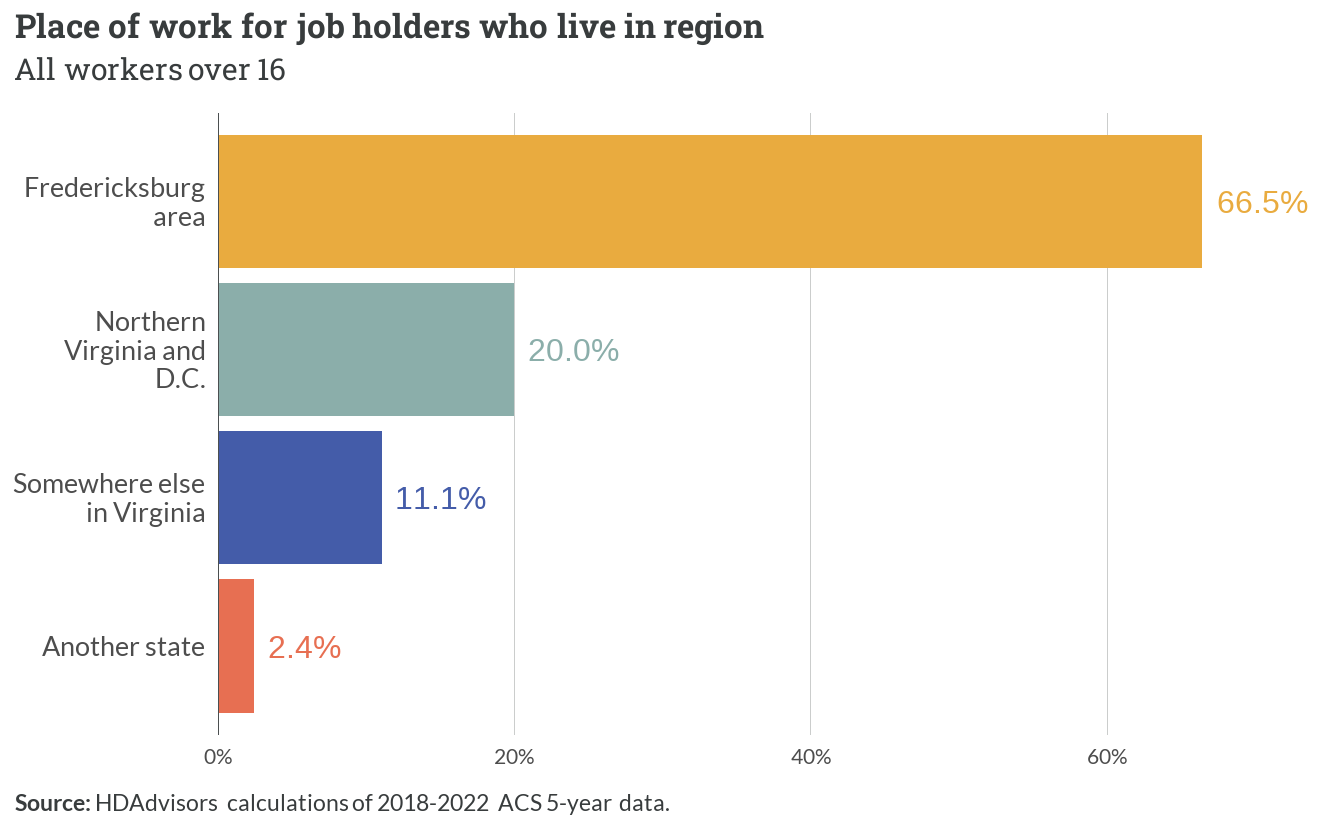
Based on this definition, 125,312 workers are both employed and live in the region. This means that two-thirds of all workers who live in the region also work within Planning District 16, versus communities outside of the region.
Additionally, this data considers those who work remotely from their homes as commuting within the Fredericksburg region. Only 37,711 workers (20% of job holders) travel to Northern Virginia or Washington D.C. for work.
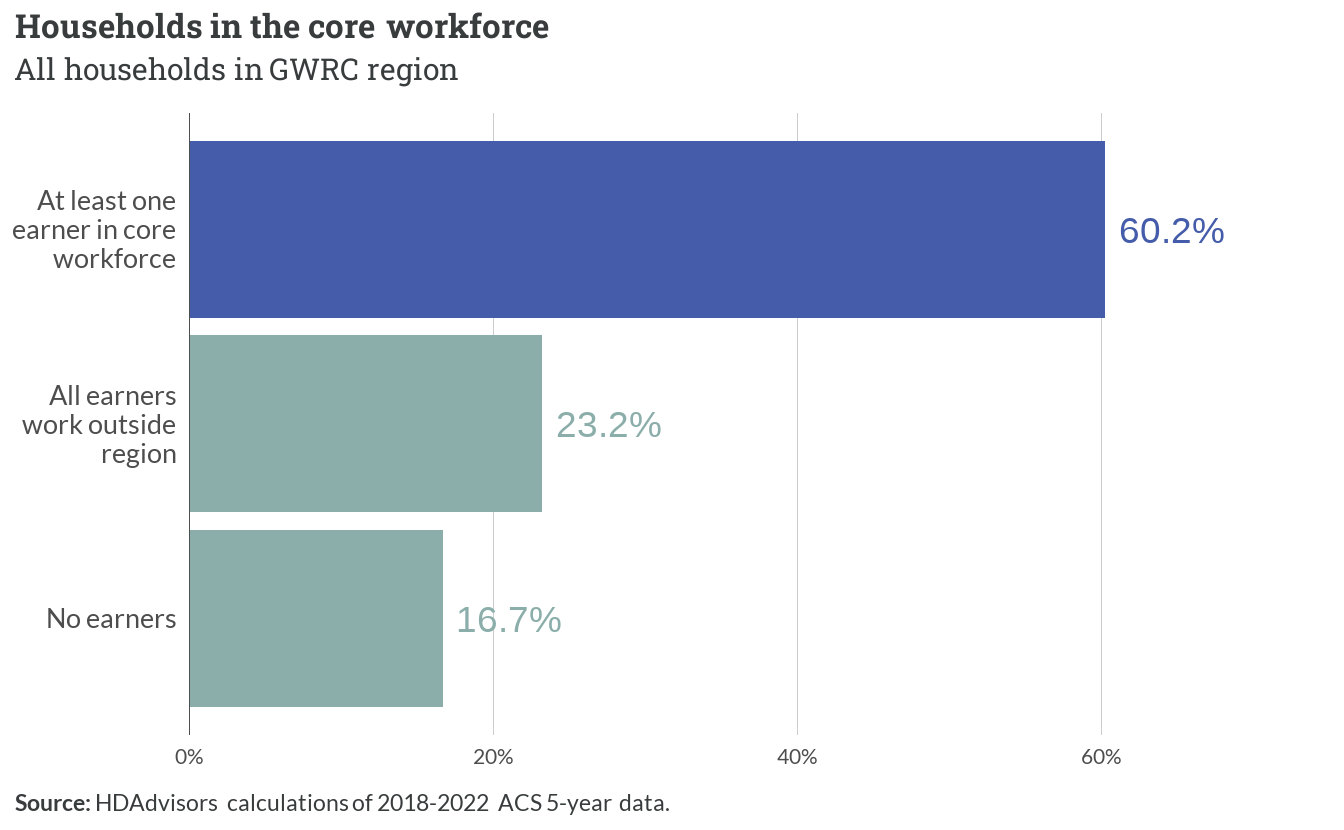
When considering whole households, most are members in the region’s core workforce: 79,545 households (60.2%) have at least one earner who works around Fredericksburg. Only 23.2% of households in the region consist of both earners leaving for work outside Planning District 16. A smaller share (16.7%), composed mostly of retirees, have no active workers.
Common industries and occupations
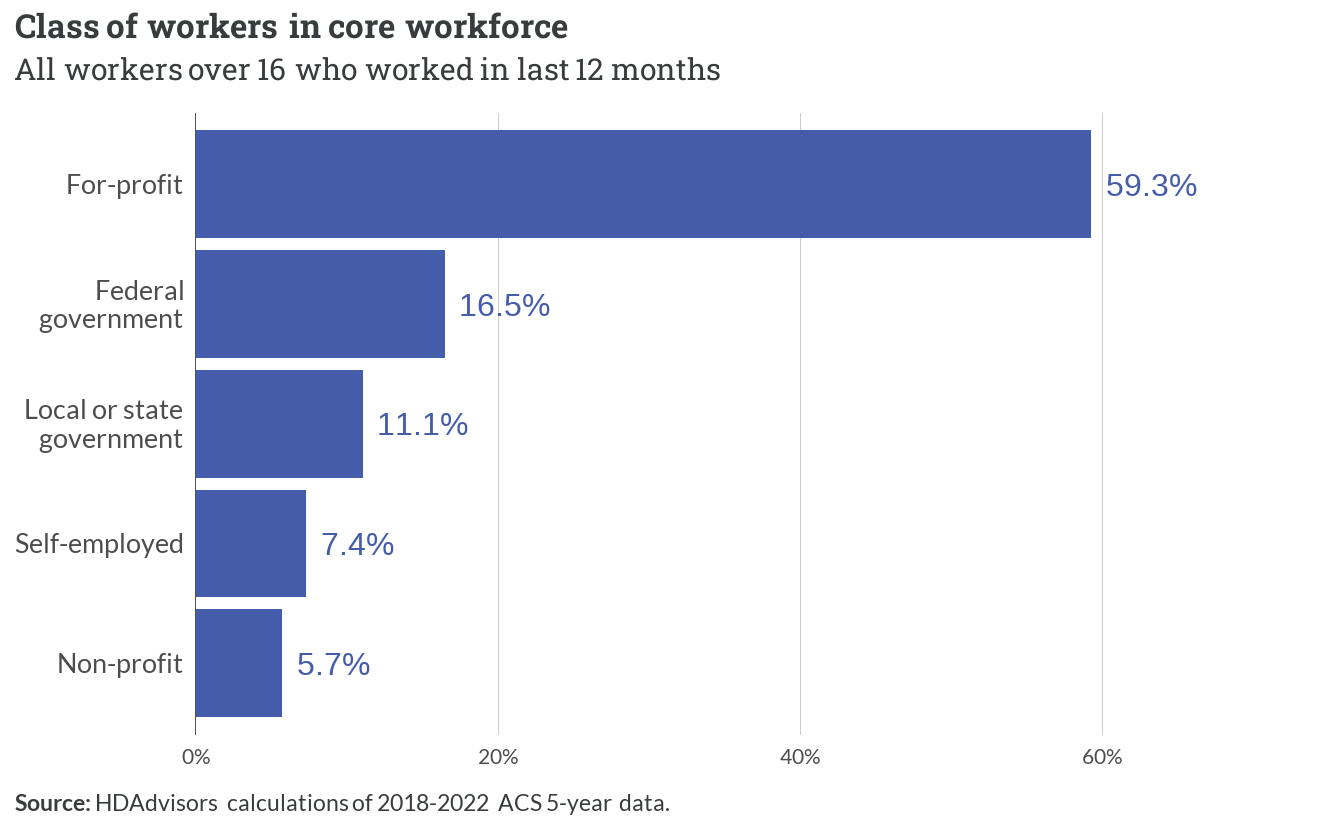
This core workforce is also primarily represented by people who work at private, for-profit businesses in the region (59.3% of workers). Smaller shares of the core workforce work for government entities, are self employed, or work at non-profits.
Regionally, 36,834 workers are employed in the Retail and Wholesale (15%) and Professional Services (15%) industries. Healthcare and Social Assistance, as well as Public Administration and Military follow behind, and paint a picture for the kind of incomes the core workforce earns.
| Industry group | Workers | Percent |
|---|---|---|
| Retail and Wholesale | 18,481 | 15% |
| Professional Services | 18,353 | 15% |
| Healthcare and Social Assistance | 16,261 | 13% |
| Public Administration and Military | 15,594 | 12% |
| Education | 12,278 | 10% |
Across all industries, the most common professions include Administrative and Clerical Support work, along with Leadership and Management. Jobs in the region that involve sales, healthcare, and logistics are also commonly held by workers who live in the area.
| Occupational group | Workers | Percent |
|---|---|---|
| Administrative and Clerical Support | 14,226 | 11% |
| Leadership and Management | 13,711 | 11% |
| Sales, Marketing, and Customer Service | 12,655 | 10% |
| Healthcare and Medical Services | 10,343 | 8% |
| Transportation and Logistics | 9,176 | 7% |
Income
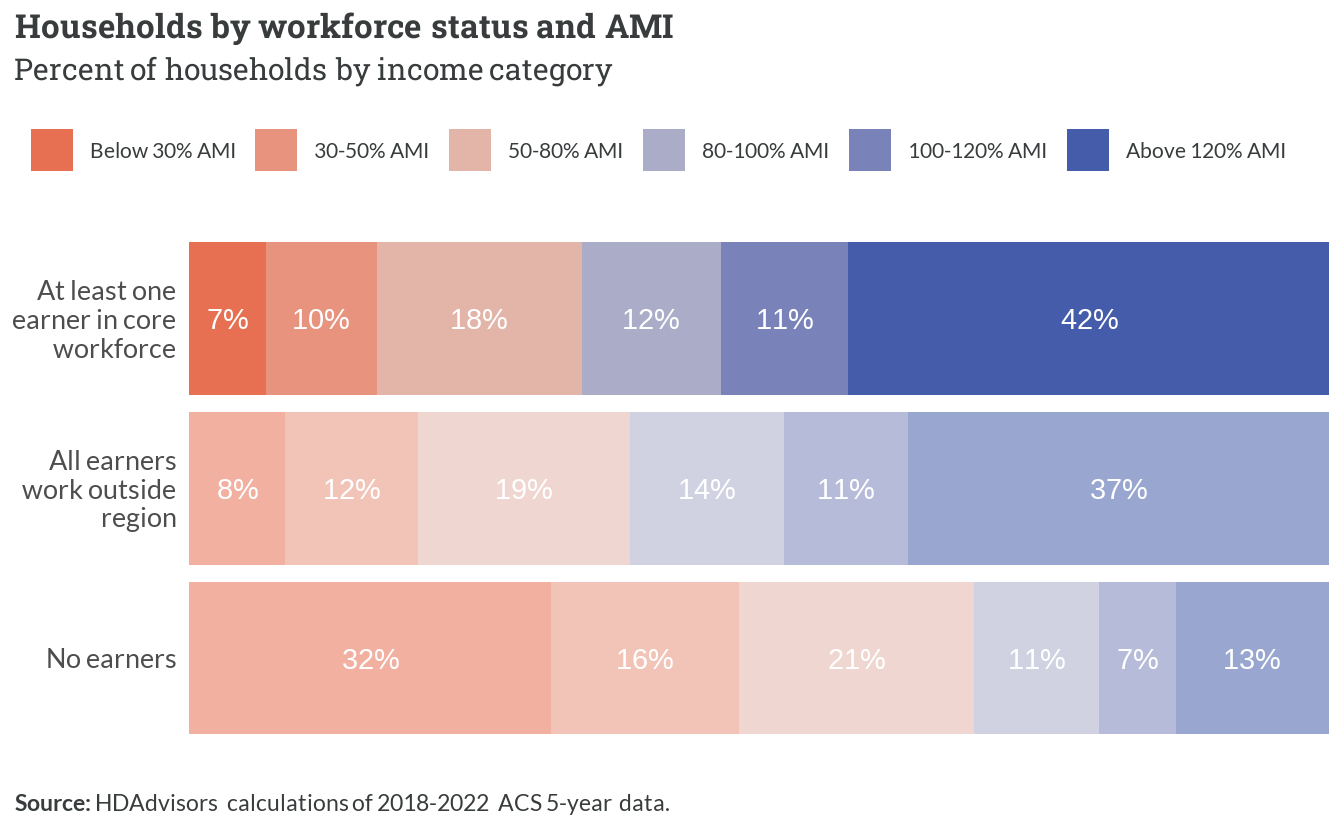
Core workforce households are slightly more likely to have higher incomes compared to households where all earners have jobs outside of the region. However, more than 13,000 core workforce households (17%) have incomes below 50% AMI. A slightly larger share (18%) have low incomes between 50% and 80% AMI.
Household characteristics
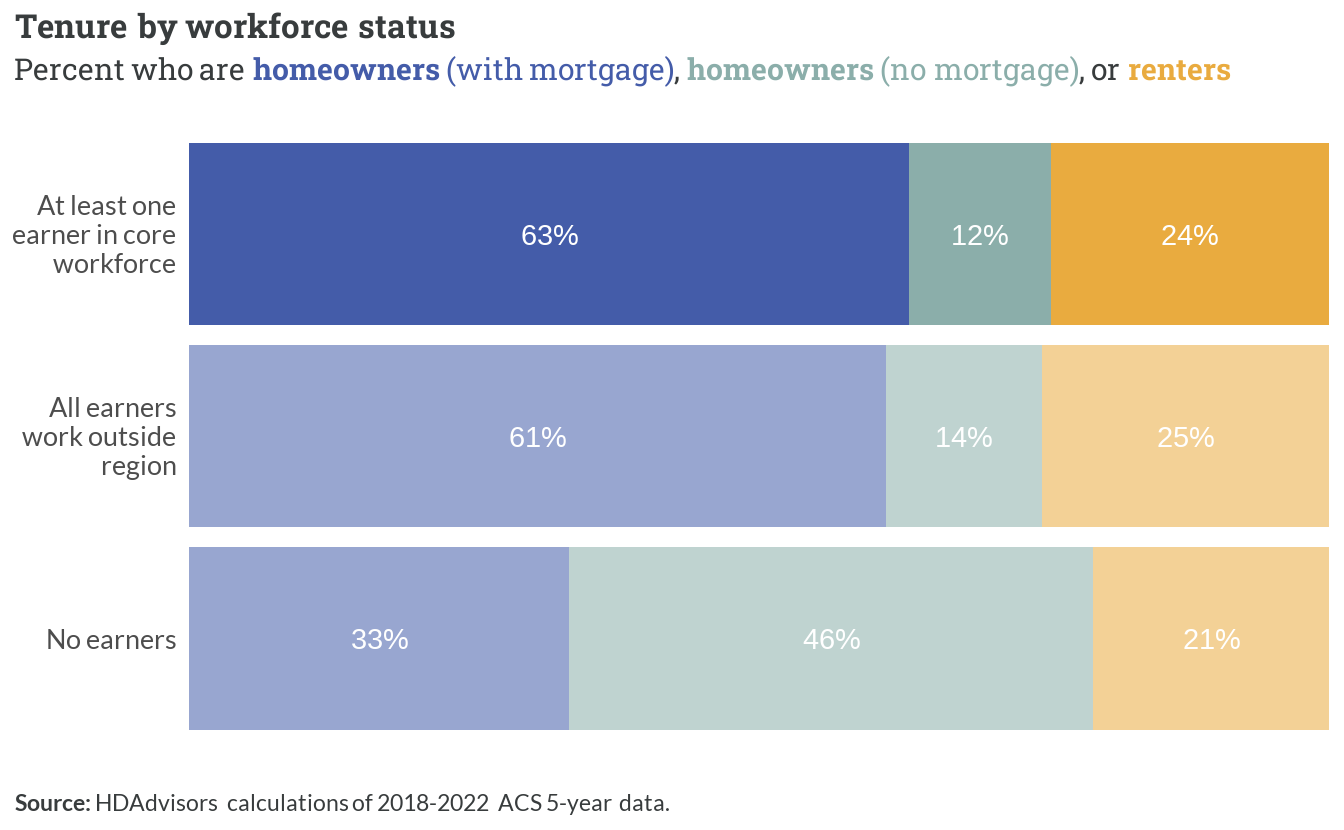
Core workforce households have similar rates of homeownership compared to non-core workforce households.
Almost half of all core workforce households are headed by couples who both hold jobs in the region. A large share of those (and 20% of all core workforce households) do not have children under 18. These “Dual-Income No Kids” households (DINKs) often have strong purchasing power in the housing market.
Single workers who live on their own account for 12% of households in the core workforce. Single-earner couples with and without children are also common. Working single parents, however, are just under 5% of the core workforce.
| Household type | Children | Earners | Percent |
|---|---|---|---|
| Couple | Yes | Two | 23% |
| Couple | No | Two | 20% |
| Individual | No | One | 12% |
| Couple | Yes | One | 8% |
| Couple | No | One | 8% |
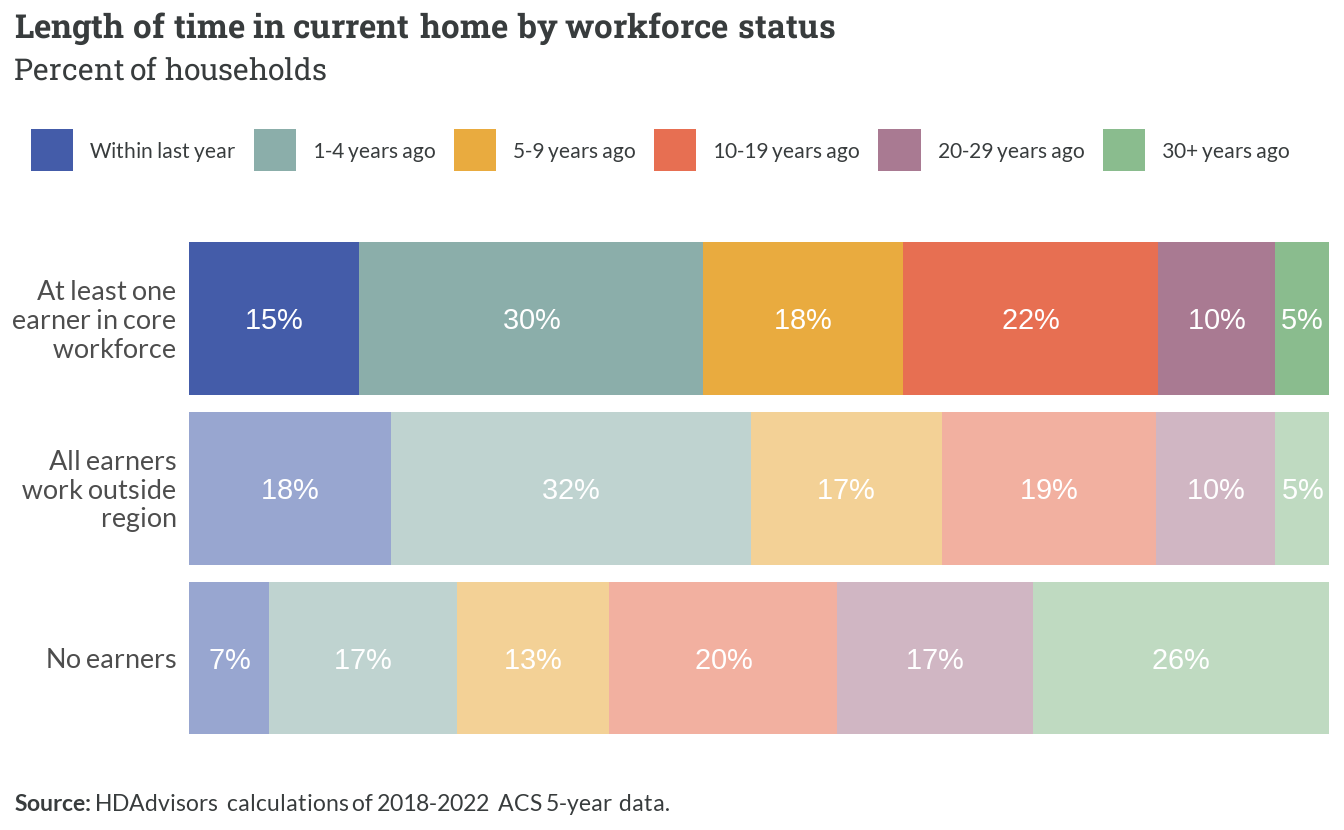
Households in the core workforce have lived in their current homes for similar periods as the non-core workforce, with just under half moving within the last four years. Many non-earner households have lived in their homes for much longer, which corresponds to a significant share of those being older retirees.
Affordability
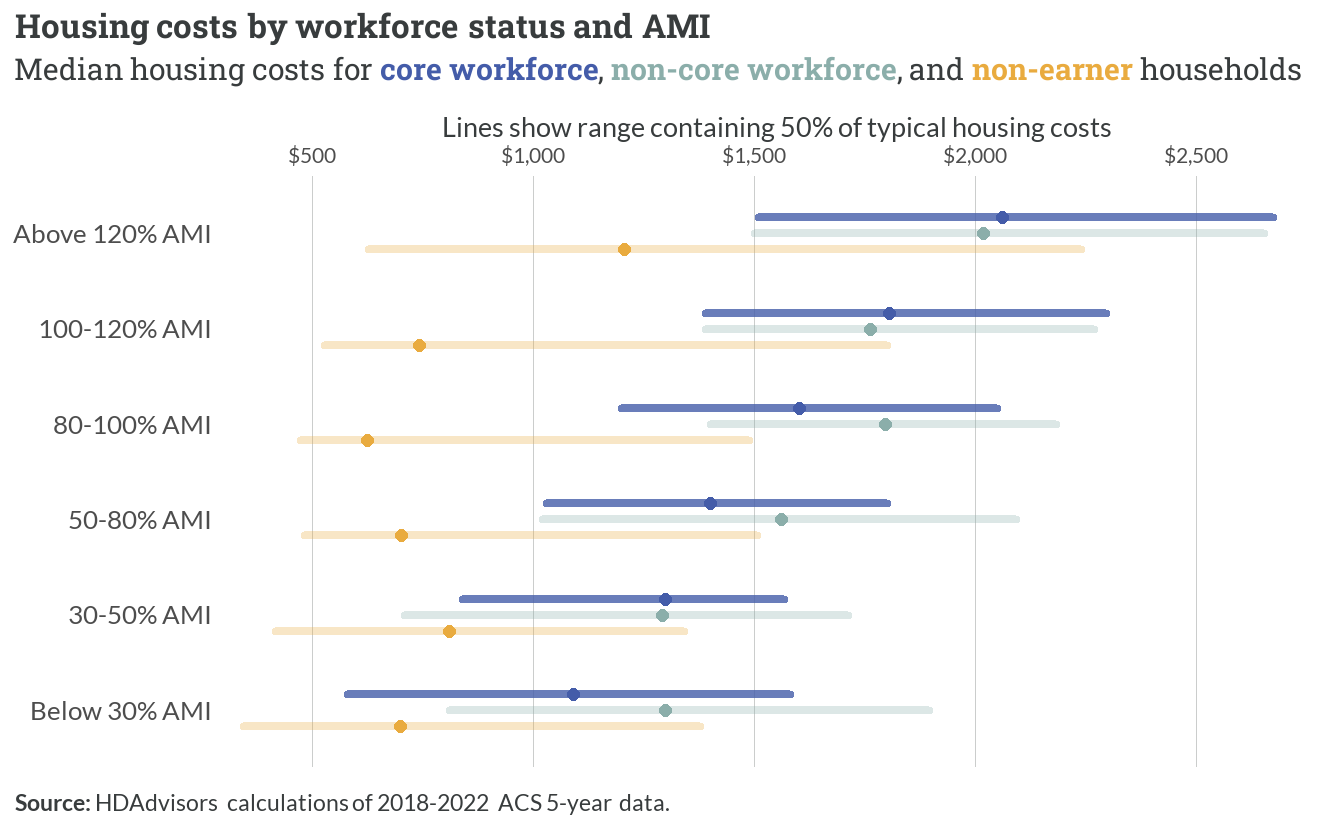
The chart below shows the range of typical housing costs for the core workforce compared to other households. Dots represent median values, and lines cover half of all values centered on the median.
For incomes above 100% AMI, core workforce households spend similar amounts on housing compared to the non-core workforce. At most incomes below 100% AMI, the core workforce spends slightly less on housing than the non-core workforce.
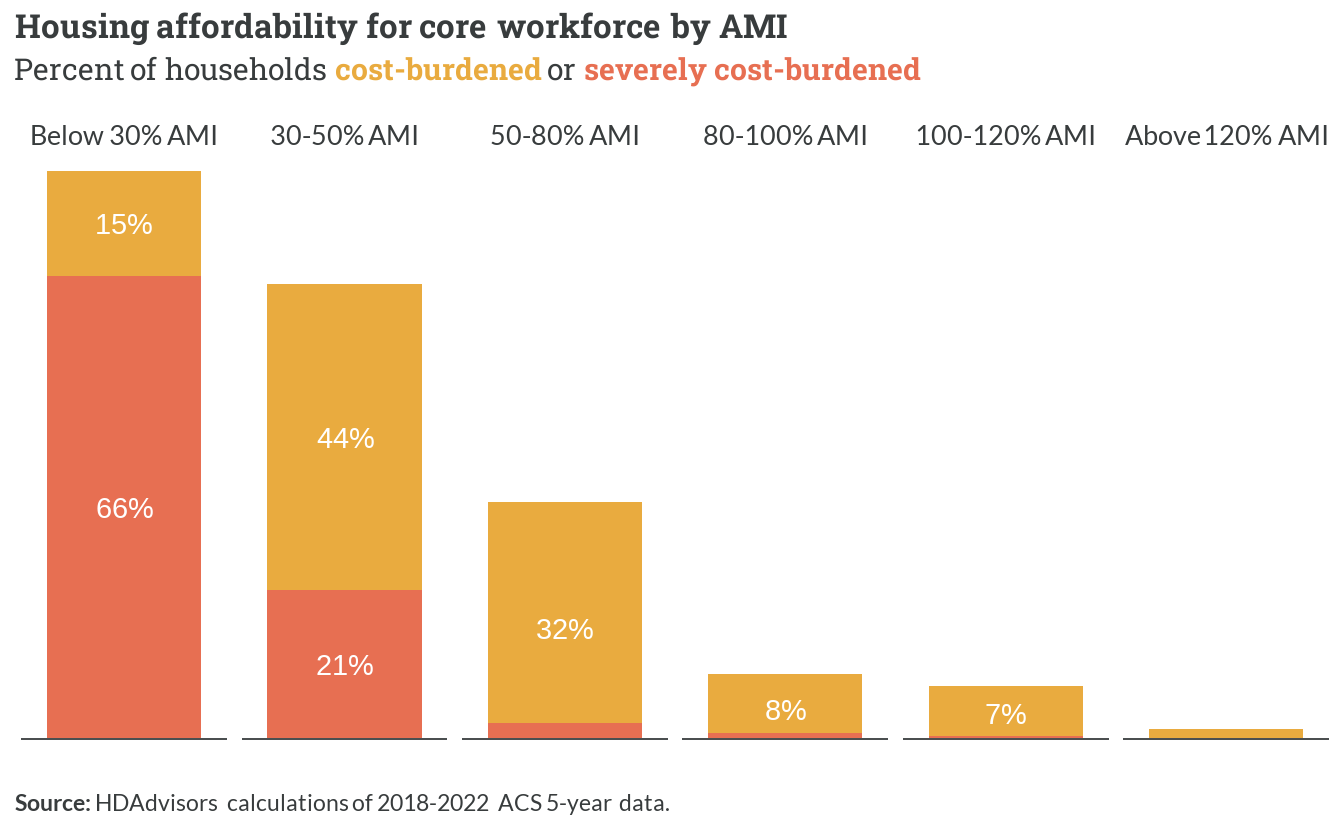
The core workforce experiences housing cost burden in a pattern similar to the regional averages for each income level. High rents paid by households under 50% AMI are the primary driver of this challenge.
2.2 Below 30% AMI
Most core workforce households living at 30% of AMI spectrum are individual earners with no children. Next is single parents households and then couples with children households with two earners at this income bracket. Overall, 7% of households with at least one earner are ELI households.
| Household type | Children | Earners | Percent |
|---|---|---|---|
| Individual | No | One | 21% |
| Single parent | Yes | One | 17% |
| Couple | Yes | One | 17% |
Extremely low income earners are the folks that keep the Fredericksburg running: laborers, cashiers, cooks, retail workers, etc. Additionally, it’s important to note that these households almost always have one earner.
| Ten Most Common Occupations | |
|---|---|
| 1. Customer Service Representatives | 6. Nursing Assistants |
| 2. Cooks | 7. Maids And Housekeeping Cleaners |
| 3. Cashiers | 8. Laborers And Freight, Stock, And Material Movers, Hand |
| 4. First-Line Supervisors Of Retail Sales Workers | 9. Sales And Related Workers, All Other |
| 5. Driver/Sales Workers And Truck Drivers | 10. Retail Salespersons |
2.3 30-50% AMI
Very low income households in the core workforce are also primarily represented by individual earners without children. Fifteen percent (15%) of VLI earner households are couples with children, then single parent households (13%). Of the core workforce spectrum brackets, VLI core workers hold the greatest share of single parents and the top three most common workforce household types are also households with only one earner.
| Household type | Children | Earners | Percent |
|---|---|---|---|
| Individual | No | One | 19% |
| Couple | Yes | One | 15% |
| Single parent | Yes | One | 13% |
VLI households hold similar occupations to the ELI core workforce.
| Ten Most Common Occupations | |
|---|---|
| 1. Construction Laborers | 6. Retail Salespersons |
| 2. Cooks | 7. First-Line Supervisors Of Retail Sales Workers |
| 3. Driver/Sales Workers And Truck Drivers | 8. Stockers And Order Fillers |
| 4. Cashiers | 9. Other Managers |
| 5. Janitors And Building Cleaners | 10. Receptionists And Information Clerks |
2.4 50-80% AMI
Low-income earners in the core workforce are primarily represented by households with two earners and children, followed by individuals and couples without kids. The low-income spectrum is where we start to see two earners in the households represented in the most common workforce types (39%), compared with VLI and ELI households.
| Household type | Children | Earners | Percent |
|---|---|---|---|
| Couple | Yes | Two | 25% |
| Individual | No | One | 16% |
| Couple | No | Two | 14% |
Low-income worker occupations overlap some with ELI and VLI households, but also see representation by educational and healthcare occupations like teachers and nurses. Education and Health Services are some of the most common industries in the entire core workforce.
| Ten Most Common Occupations | |
|---|---|
| 1. Driver/Sales Workers And Truck Drivers | 6. Stockers And Order Fillers |
| 2. Cashiers | 7. Registered Nurses |
| 3. Retail Salespersons | 8. Maids And Housekeeping Cleaners |
| 4. First-Line Supervisors Of Retail Sales Workers | 9. Laborers And Freight, Stock, And Material Movers, Hand |
| 5. Elementary And Middle School Teachers | 10. Customer Service Representatives |
2.5 80-100% AMI
Moderate income core workers are often couples with one or two earners in the household. Most of these households are couples with children (38%).
| Household type | Children | Earners | Percent |
|---|---|---|---|
| Couple | Yes | Two | 28% |
| Couple | No | Two | 18% |
| Couple | Yes | One | 10% |
Moderate income earners see greater representation from education industries, with elementary and middle school teachers with the most common occupation in this spectrum bracket. The occupations represented for households in this 80-100% AMI bracket appear to be professions with greater educational attainment.
| Ten Most Common Occupations | |
|---|---|
| 1. Elementary And Middle School Teachers | 6. Waiters And Waitresses |
| 2. Retail Salespersons | 7. Secretaries And Administrative Assistants, Except Legal, Medical, And Executive |
| 3. Software Developers | 8. First-Line Supervisors Of Retail Sales Workers |
| 4. Customer Service Representatives | 9. Insurance Sales Agents |
| 5. Other Managers | 10. Landscaping And Groundskeeping Workers |
2.6 100-120% AMI
Many above-average income households are couples with two earners (37%), with a large share of those having children.
| Household type | Children | Earners | Percent |
|---|---|---|---|
| Couple | Yes | Two | 27% |
| Couple | No | Two | 18% |
| Individual | No | One | 9% |
Interestingly, Cashiers are the most common occupation for those with above moderate income in the core workforce. As described below, as the highest share of these households contain two earners, it’s likely that cashiers and retail supervisors live with other high earners, increasing the overall income of the household. Occupations in this category appear less correlated to positions that require higher educational attainment.
| Ten Most Common Occupations | |
|---|---|
| 1. Cashiers | 6. Other Managers |
| 2. First-Line Supervisors Of Retail Sales Workers | 7. Retail Salespersons |
| 3. Driver/Sales Workers And Truck Drivers | 8. Software Developers |
| 4. Laborers And Freight, Stock, And Material Movers, Hand | 9. Postal Service Mail Carriers |
| 5. Elementary And Middle School Teachers | 10. Teaching Assistants |
2.7 Above 120% AMI
Working couples are the most represented household type for high income earners in the core workforce (more than 60%). Couples with no children but multiple earners would include adult-age working children living with their parents.
| Household type | Children | Earners | Percent |
|---|---|---|---|
| Couple | No | Two | 30% |
| Couple | Yes | Two | 25% |
| Couple | No | Multiple | 11% |
Much like above moderate income households, the inclusion of some typically lower-wage jobs here (e.g. cashiers) implies that many live with a second earner who brings in relatively more income.
| Ten Most Common Occupations | |
|---|---|
| 1. Other Managers | 6. Retail Salespersons |
| 2. Elementary And Middle School Teachers | 7. Secretaries And Administrative Assistants, Except Legal, Medical, And Executive |
| 3. Software Developers | 8. Cashiers |
| 4. First-Line Supervisors Of Retail Sales Workers | 9. Financial Managers |
| 5. Registered Nurses | 10. Driver/Sales Workers And Truck Drivers |