5 Current housing gaps
5.1 Overview
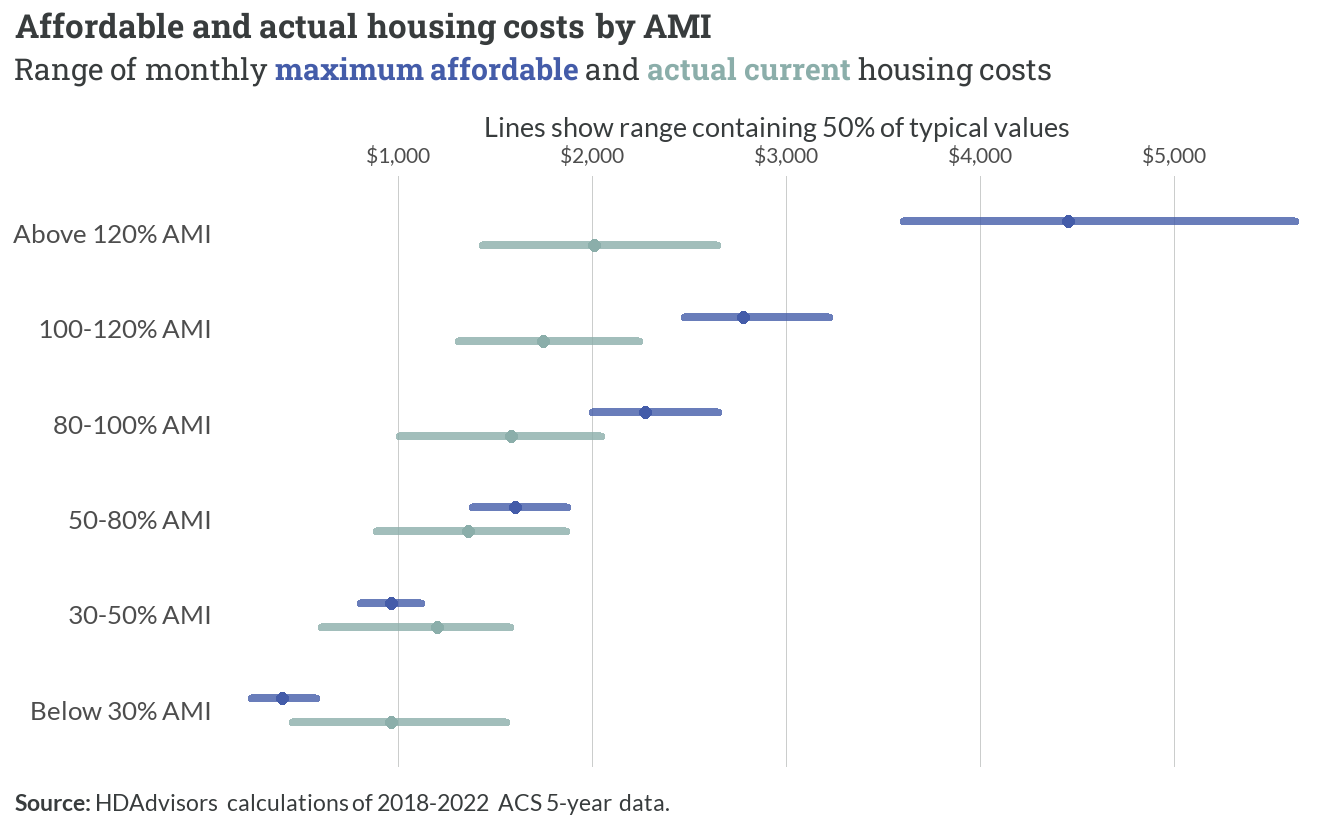
Monthly housing costs show substantial variation across income bands in the Fredericksburg region. Maximum affordable housing costs scale proportionally with Area Median Income (AMI), ranging from about $1,000 monthly for households below 30% AMI to over $4,000 for those above 120% AMI.
However, actual current housing costs demonstrate a compressed range between approximately $1,500 and $2,500 monthly across all income bands, creating particular affordability challenges for lower-income households.
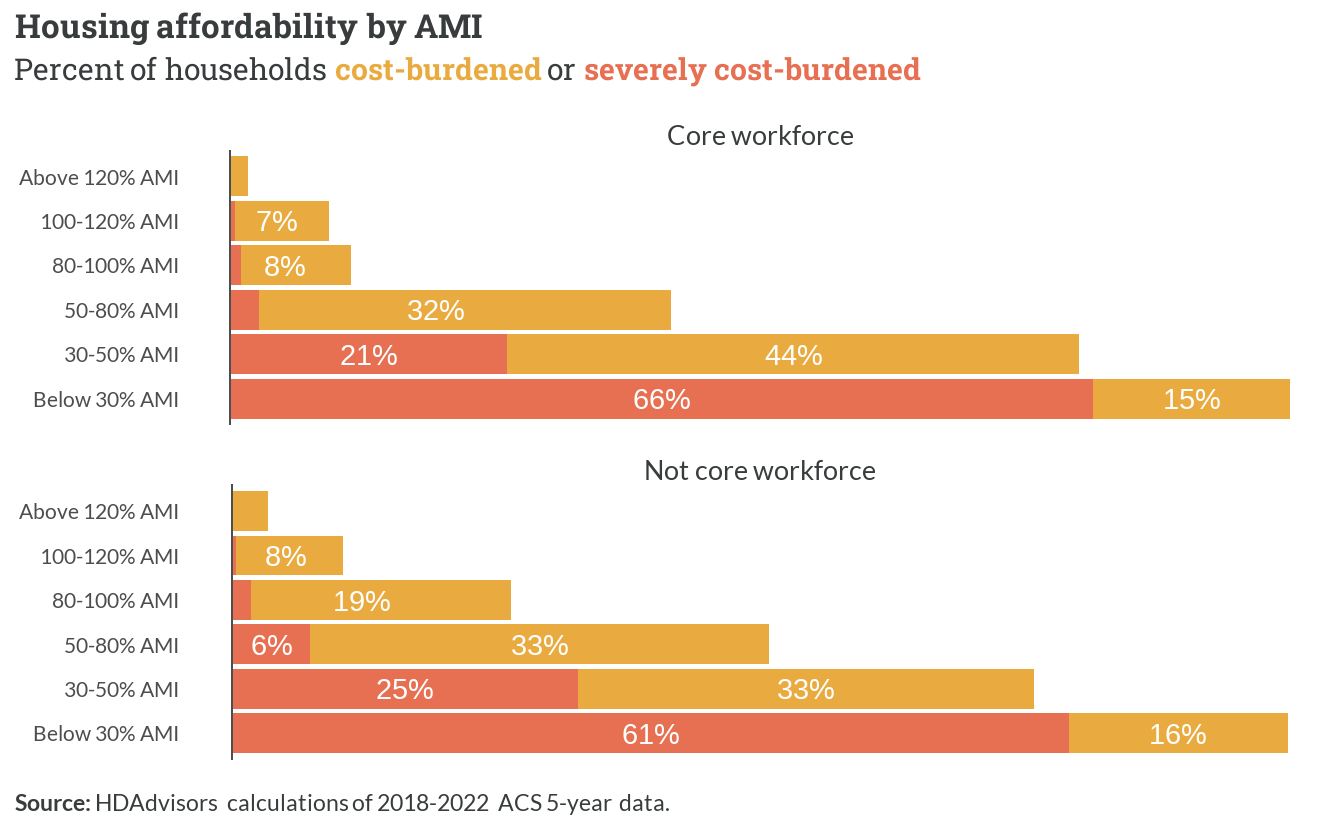
As a result of this mismatch, housing cost burdens reveal stark disparities between income groups, with similar patterns varying between core workforce and other households. Among core workforce households, severe cost burdens affect about two-thirds of those below 30% AMI, while an additional 44% of households between 30-50% AMI face moderate cost burdens.
The burden decreases significantly for higher income brackets, with only 7-8% of households above 80% AMI experiencing any cost burden. Similar patterns emerge for non-core workforce households, though with notably higher cost burdens in the 80-100% AMI range at 19% compared to 8% for core workforce households.
5.2 Rental housing gap
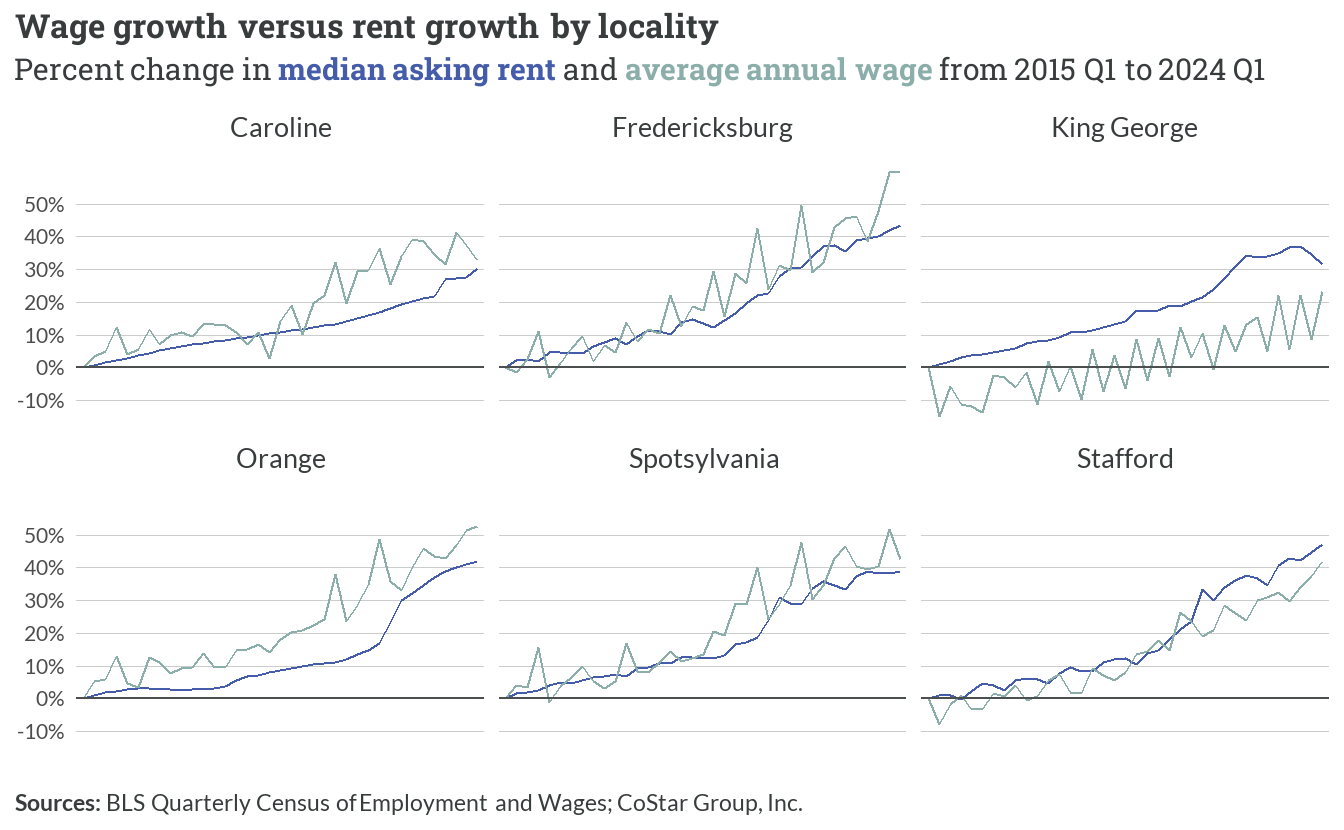
Wage and rent growth patterns across the Fredericksburg region from 2015 to 2024 reveal a concerning dynamic of persistent unaffordability. While both metrics demonstrate parallel upward trajectories, with cumulative increases ranging from 30-50% across localities, this synchronization effectively absorbed most household income gains into housing costs.
This pattern is particularly evident in Fredericksburg proper, where the close tracking between wage and rent growth meant that households earning the average annual wage saw minimal improvement in their discretionary income after accounting for housing expenses.
The parallel growth trajectories effectively locked in existing affordability challenges, as wage increases that might have provided relief from housing cost burdens were instead captured by proportional rent increases. This dynamic appears most pronounced in urban centers like Fredericksburg and Stafford, where the close coupling between wage and rent growth perpetuated, rather than alleviated, existing patterns of housing stress for cost-burdened households.
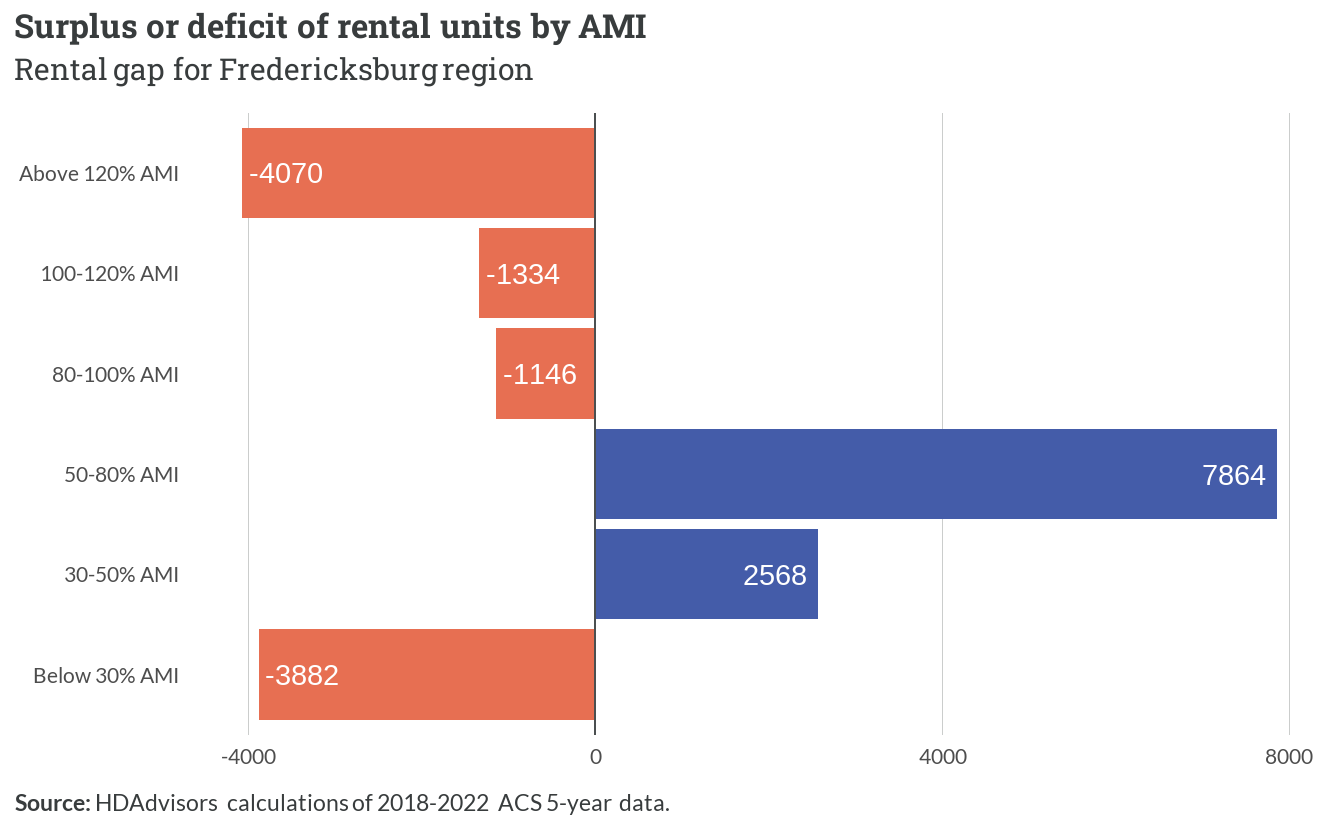
The Fredericksburg region faces significant rental housing gaps at both ends of the income spectrum. Nearly 4,000 extremely low-income households (earning below 30% AMI) lack access to affordable rental units, while a similar deficit exists for households earning above 120% AMI.
The middle market shows substantial surpluses, particularly for households earning between 50-80% AMI where there are almost 8,000 more units than households. This suggests many higher-income renters are likely occupying units that would be affordable to lower-income households, while the lowest-income renters face severe challenges finding affordable housing.
Core workforce rental affordability
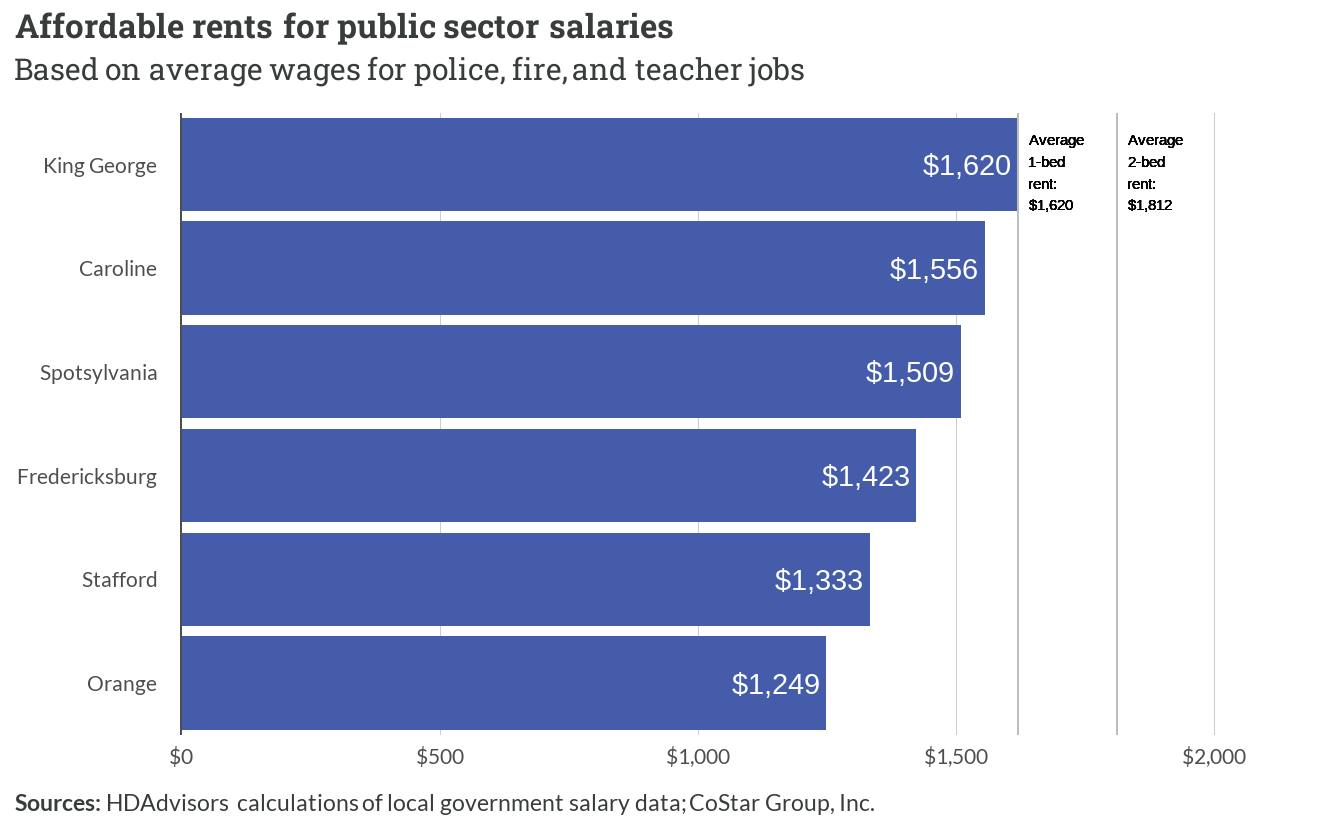
Public sector workers in King George can afford the highest monthly rent at $1,620, followed by Caroline at $1,556 and Spotsylvania at $1,509. Police, fire, and teaching professionals in Fredericksburg and Stafford face somewhat tighter rental budgets, with affordable limits of $1,423 and $1,333 respectively. Orange has the lowest affordable rent threshold at $1,249.
For context, the average one-bedroom unit in the region rents for $1,620, while two-bedroom units average $1,812.
5.3 Homeownership gap
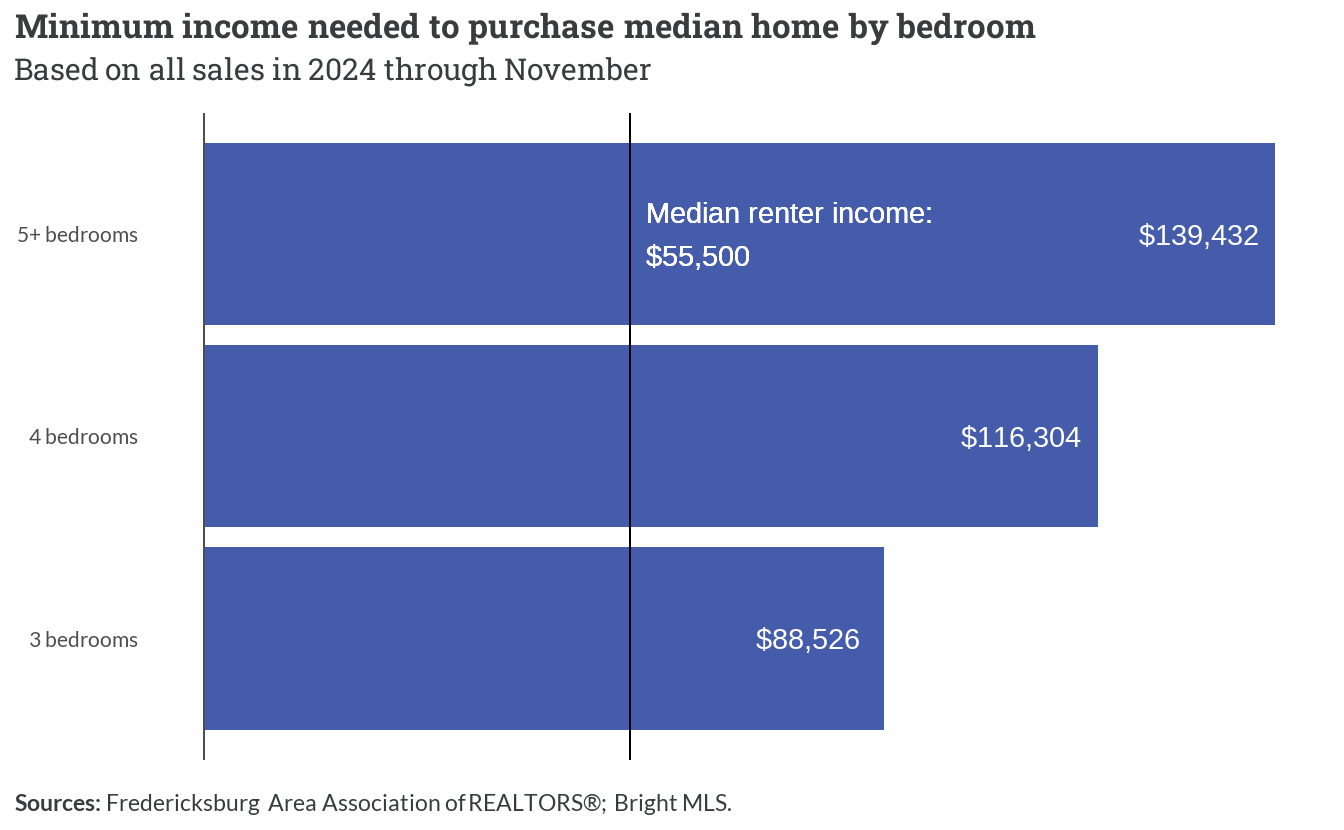
Most modestly-sized homes – let alone larger ones — are out of reach for typical renters. The median renter income of $55,500 falls $33,026 short of affording even a three-bedroom home. This gap expands dramatically for larger homes, with four and five-plus bedroom homes requiring more than double the typical renter’s income.
This disparity effectively locks many renters out of homeownership entirely, as the income requirements for every home size far exceed their earning capacity. The situation suggests a significant portion of the region’s renters may remain unable to build wealth through homeownership unless there are major changes in either home prices, interest rates, or wage growth.
Assumptions for calculations of minimum incomes:
- Loan terms = 30-year fixed rate mortgage at 6.50%
- Taxes and insurance = 25% of monthly loan payment
- Down payment = 20% of purchase price
- Debt-to-income ratio = 0.28
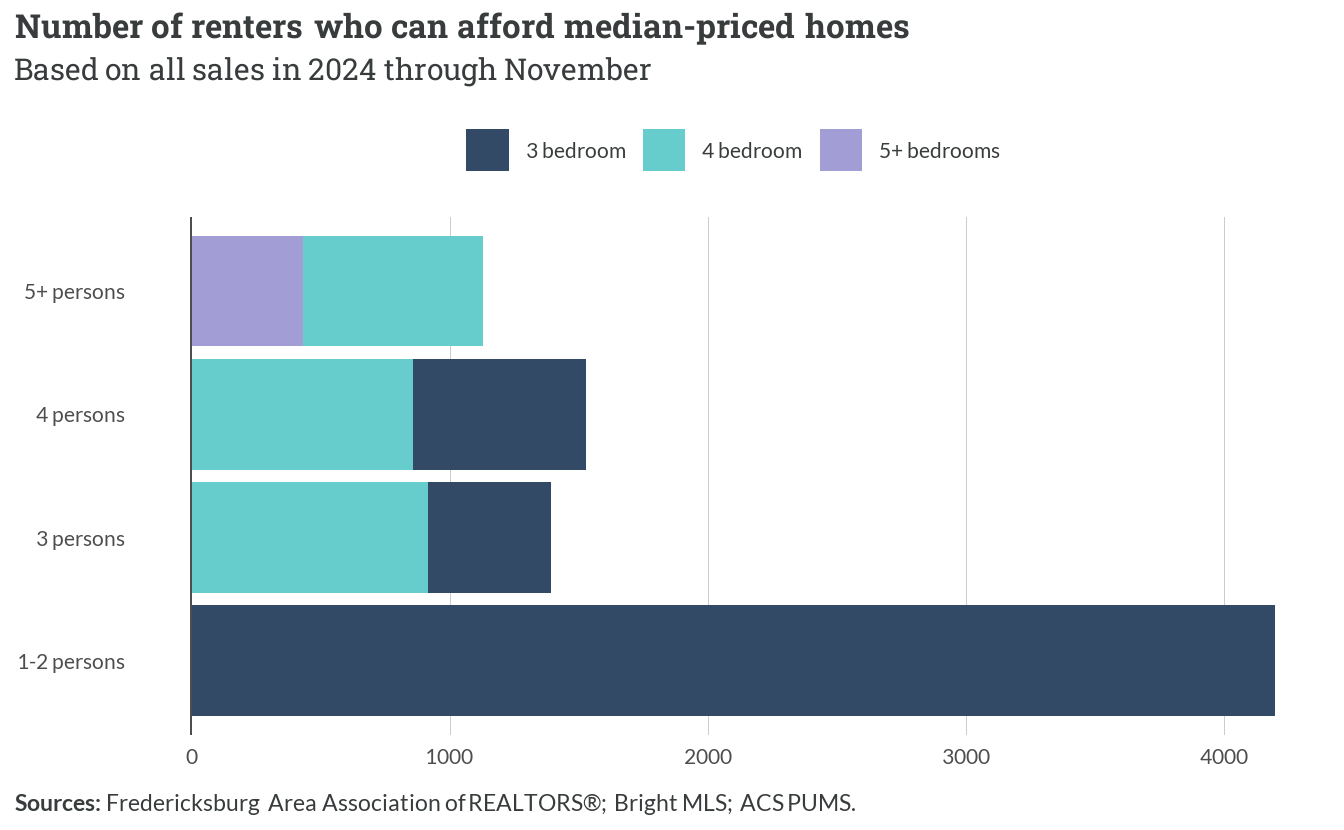
Among households with 1-2 persons, approximately 4,000 current renters could theoretically afford a 3-bedroom home based on their income. However, the market dynamics become more complex for larger households.
For 3-person households, about 1,200 renters could afford homes split between 3 and 4 bedrooms, while 4-person households show a similar pattern with roughly 1,000 qualified buyers. The most constrained segment appears to be households with 5+ persons, where only about 500 renters could afford homes sized appropriately for their needs (4+ bedrooms).
Note
This analysis suggests a substantial pool of qualified buyers across all household sizes who remain in the rental market, likely due to supply constraints rather than financial limitations.
Core workforce homeownership affordability
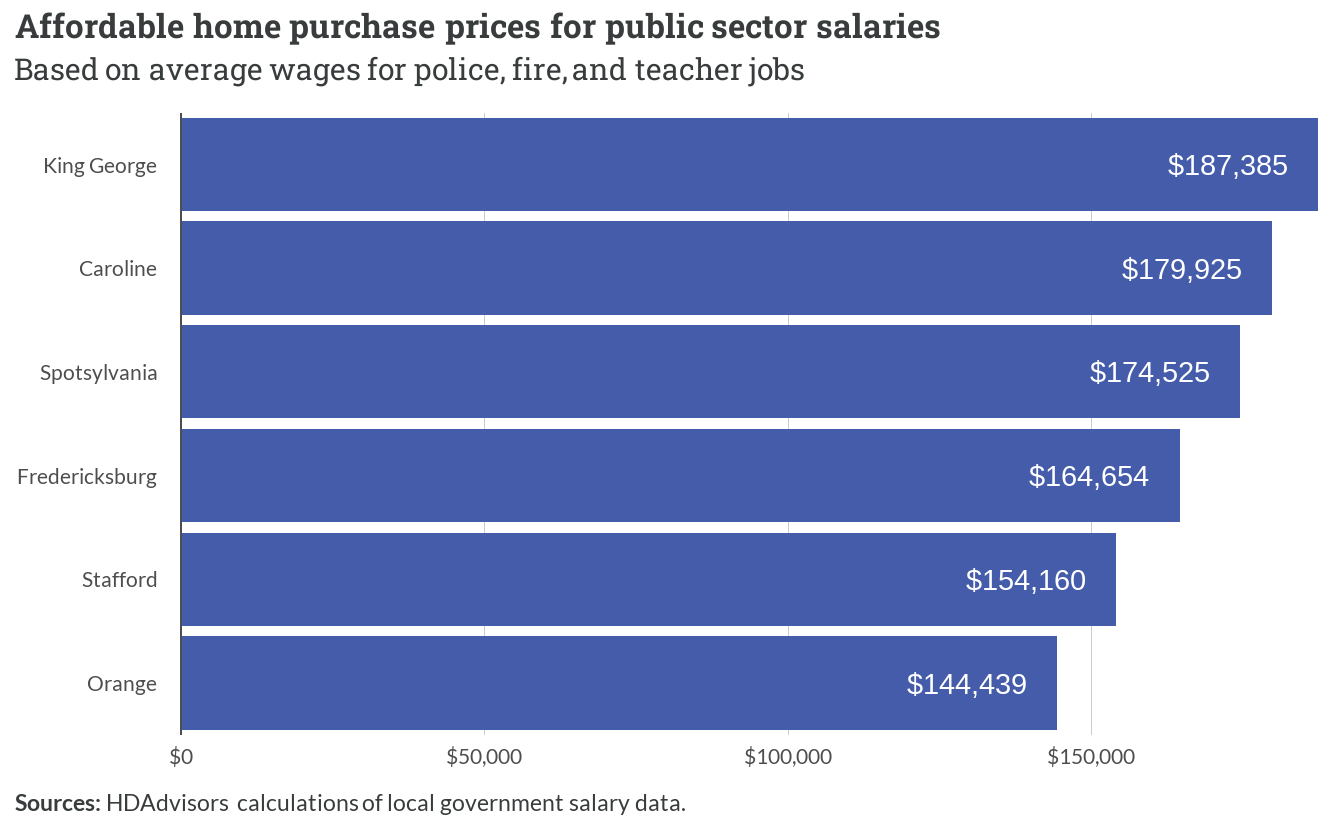
The data reveals a significant affordability gap for public sector workers in the region. While their salaries support maximum home purchases ranging from $144,439 in Orange to $187,385 in King George, the actual median home prices are substantially higher.
Stafford shows the starkest contrast — while public sector workers can afford homes up to $154,160, the median sales price has climbed above $500,000 by 2024. Similar gaps exist in all localities, with median prices typically ranging from $350,000 to $450,000, far exceeding what police officers, firefighters, and teachers can afford on their salaries.