Methods & Data
Defining Heirs’ Property
Heirs’ property can arise when someone dies without a will, or when an estate is never fully resolved and the title is not updated. The property may pass to several descendants, with each heir inheriting an undivided interest in the property. Family members continue living in the home, maintaining it, and paying taxes even while the deed remains in the deceased owner’s name. Without clear title, they may have difficulty selling or refinancing the property, borrowing against it for repairs, receiving federal disaster aid, or passing it cleanly to the next generation. Fractured ownership can also lead to the forced selling of a property.
Because heirs’ property is a legal condition that parcel records do not directly identify, it is difficult to confirm property status from administrative data alone. This study therefore uses public and administrative records to screen for signs consistent with unresolved inherited ownership, helping identify areas where outreach and case-level legal review may be most useful.
Throughout the report, “flagged parcel rate” means the share of parcels classified as high confidence or likely by the screening index.
Below, we describe the methodology used to screen parcels for signs of heirs’ property.
Research
Published heirs’ property studies generally identify likely cases in one of two ways. Some rely on ownership language in assessor records, flagging terms such as estate, heirs, or et al.1 Others compare the owner of record with death records and consider how long the deed has remained unchanged.2 This study combines both approaches and adds information on ownership structure, mailing address, tenure, and postal vacancy. Because no single indicator is conclusive, parcels are classified only when several signals point in the same direction.
The regional scope creates an additional methodological challenge. For example, the Philadelphia tangled-title study conducted by The Pew Charitable Trusts drew from a single municipal assessment system.3 In turn, this study covers six jurisdictions, each with its own assessor data, field definitions, parcel-number formats, and recordkeeping practices. The screening process therefore required both a common regional framework and locality-specific steps for cleaning and matching records. Those decisions are documented below.
Building on the Thomson and Bailey Index
Combining the methodologies noted above, this work builds on the parcel-screening index developed by Ryan Thomson and Conner Bailey to estimate heirs’ property across the South and Appalachia.4 It also builds on generous feedback from researchers at the Housing Assistance Council (HAC) and New York University’s Furman Center for Real Estate and Urban Policy. In short, this study adapts their summative parcel-screening approach, and adds direct deceased-owner matching, vacancy and ownership-structure indicators, and separate confidence tiers calibrated to the Richmond region.5
How Parcels Were Screened
Reading deeds to identify heirs’ property at scale across six jurisdictions is infeasible. Instead, the study scored every parcel on a set of ownership signals that, taken together, make heirs’ status likely. The index was built in stages.
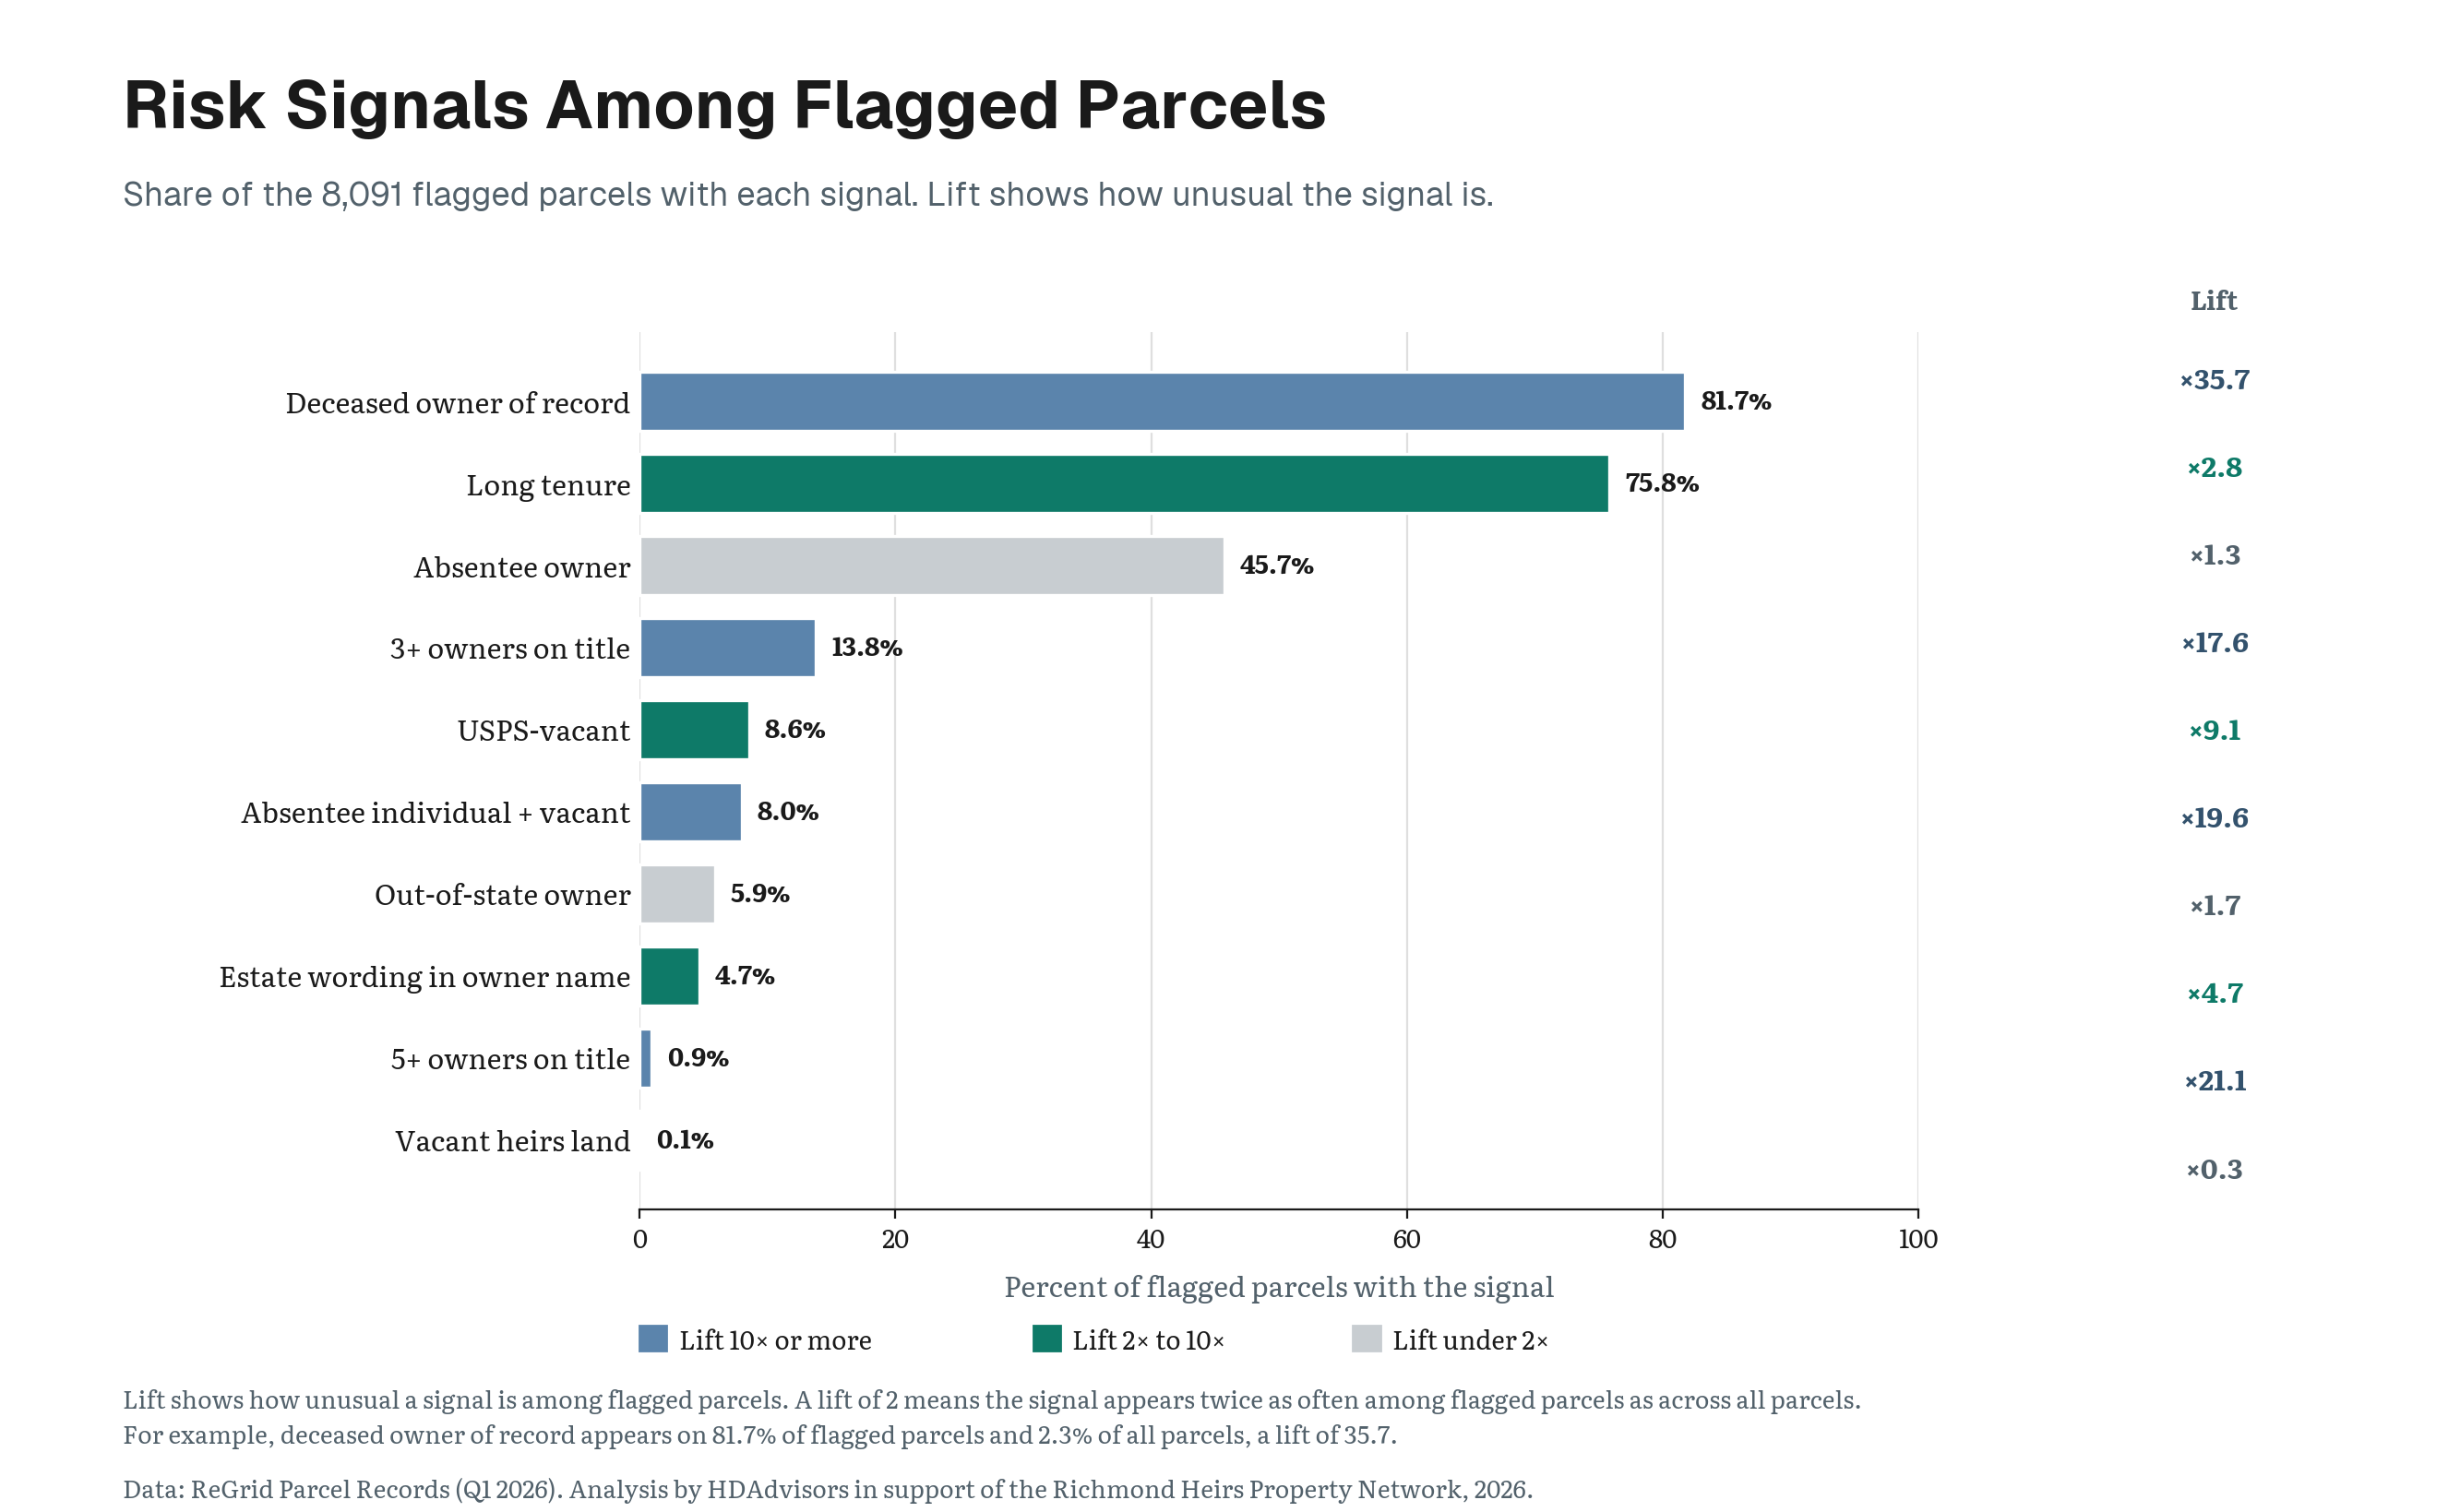
First, the study began with the facts recorded about the parcel itself including estate language in the owner name; decades without a recorded transfer; postal vacancy; a tax bill mailed somewhere other than the property; and multiple owners of record.
Before acquiring deceased-owner data, a small sample of parcel records was compared with deeds accessed through Virginia’s Secure Remote Access system. Assessor and deed names generally aligned among sampled low and moderate risk parcels, while discrepancies appeared among sampled higher risk records. Because such discrepancies can reflect record timing, data quality, or other ownership changes, they were not treated as proof of heirs’ property. The exercise served as a limited data-quality check and reinforced the need for deceased-owner matching and case-level legal review.
Second, parcels owned by businesses, institutions, or government entities cannot be heirs’ property. Those records were filtered out, and the remaining owner fields across the six assessor datasets were further parsed into around 450,000 individual person-owner records.
Third, each person-owner record was checked against a commercial deceased-suppression database built around the Social Security Administration’s Death Master File. Where one owner holds several parcels, a confirmed death applies to each parcel that names that owner. The deceased-owner match was then folded into the index alongside the parcel-facts signals, with the promotion rules described below.
Heirs’ Index Signal Set:
- a deceased owner of record
- explicit estate language in the owner name itself, words like HEIRS, ESTATE, LIFE ESTATE, and DECEASED6
- long ownership tenure, meaning the recorded sale occurred twenty years ago or more
- absentee ownership, a tax bill mailed somewhere other than the property, including out of state
- multiple owners of record, meaning three or more named owners on one parcel7
- USPS vacancy status8
Signals are weighted rather than simply counted, and the same weights, cutoffs, and promotion rules apply identically in all six jurisdictions.9
| Signal | Points |
|---|---|
| Explicit estate language in the owner name | 2 |
| Deceased owner of record | 2 |
| USPS-vacant | 2 |
| Vacant heirs' land composite: no readable owner name, no building, and long tenure together | 2 |
| Long ownership tenure | 1 |
| Absentee mailing address | 1 |
| Out-of-state mailing address, in addition to the absentee point | 1 |
| Individual owner who is both absentee and USPS-vacant | 1 |
| Three or four owners of record | 1 |
| Five to eight owners of record, replacing the three-or-four point | 2 |
The composite score sorts each parcel into a tier. A score of five or more reaches High Confidence. A score of three or four accompanied by a confirmed deceased owner reaches the Likely tier. Two promotion rules then sit on top of the point total:
- A parcel held by three to eight named owners where one is confirmed deceased is promoted to the High Confidence tier, as regionally this is a frequent pattern of heirs’ properties.
- A parcel held by three to eight named owners whose tax bill goes to an address away from the property, an arrangement in which one sibling handles the tax bill from a different address while another lives in the home, is promoted to the Likely tier. It is weighty evidence, but it is never sufficient for High Confidence on its own.
Promotion rules can only raise a parcel’s tier, never lower one, and a deceased match alone, with no corroborating signal, does not reach either flagged tier.
Parcel Universe
The denominator for every rate in this study is 381,852 parcels, every parcel on the assessment rolls of the six jurisdictions in the Richmond–Petersburg region, spanning 258 census tracts. Parcel records come from ReGrid (accessed Quarter 1, 2026), which consolidates county assessment rolls into a single national schema.
Each assessor dataset contained some shared and some diverging properties. Land-use codes follow six different county-specific schemes that are non-harmonized, and use descriptions exist in only three of the six counties. The study therefore uses the full parcel stock as its denominator rather than attempting a residential-only universe, for two reasons.
- One fixed denominator applies the same rule in all six jurisdictions. A residential filter would have to be built six different ways from six incompatible coding schemes, putting a different error into each jurisdiction’s rate.
- Heirs’ property is not confined to one land-use class. While a business cannot be an heirs’ property, in this region flagged parcels include occupied family homes as well as inherited empty lots, and a use-class filter across six jurisdictions raises the risk of dropping legitimate heirs’ properties.
Separating Businesses from Families
Assessor parcel data carries a ready-made corporate indicator. However, the study tested it before trusting it alone to filter corporate properties. It failed in both directions. It missed real corporations, including some of the region’s largest institutional landholders, and it wrongly flagged people whose names merely sound like businesses, families with names like Bank, Temple, or Church, among them genuine estates.
Corporate identification was therefore done from the owner names themselves. Name rules built around business and institutional language gathered every candidate parcel into a single review list, 559 parcels in all, and every candidate was ruled on individually.
Owner-name designations such as “Estate of,” “Heirs of,” “Life Estate,” “Et al.,” and “Deceased” were treated as strong but non-decisive indicators. This approach adapts Thomson and Bailey’s weighted-index framework and is consistent with research by Dobbs and Johnson Gaither, who include “estate” when it describes an owner’s legal status rather than a real-estate business or subdivision. An owner-name designation alone could not place a parcel in the heirs-property population; additional evidence was required. Trust designations did not contribute affirmative heirs-property points, although trust-owned parcels remained eligible for screening through the other indicators.
As mentioned, no name-based screen is perfect in either direction. A person whose surname reads as a business word can be wrongly caught, and the individual review exists to correct exactly that error. A business whose legal name reads like a person’s name can slip through, and that residual error is bounded by scale. Confirmed corporate owners amounted to well under one percent of the flagged population.
How Hot and Cold Spots Were Identified
Heirs’ properties are not spread evenly across the region. Some neighborhoods contain more flagged parcels than others. We classify areas with many flagged parcels as a hot spot if it’s part of a larger area where elevated heirs-property rates occur together. Conversely, a cold spot is an area where low rates occur together.
Why do we require multiple neighborhoods to be together before calling it a hot spot? Because one neighborhood can post a high rate simply because of a few unusual properties or a small number of parcels. A connected concentration across several neighboring areas is stronger evidence of a geographic pattern. It is therefore more useful for understanding broader demographic factors shaping heirs’ property, as well as helpful to direct where outreach and assistance may be most needed.
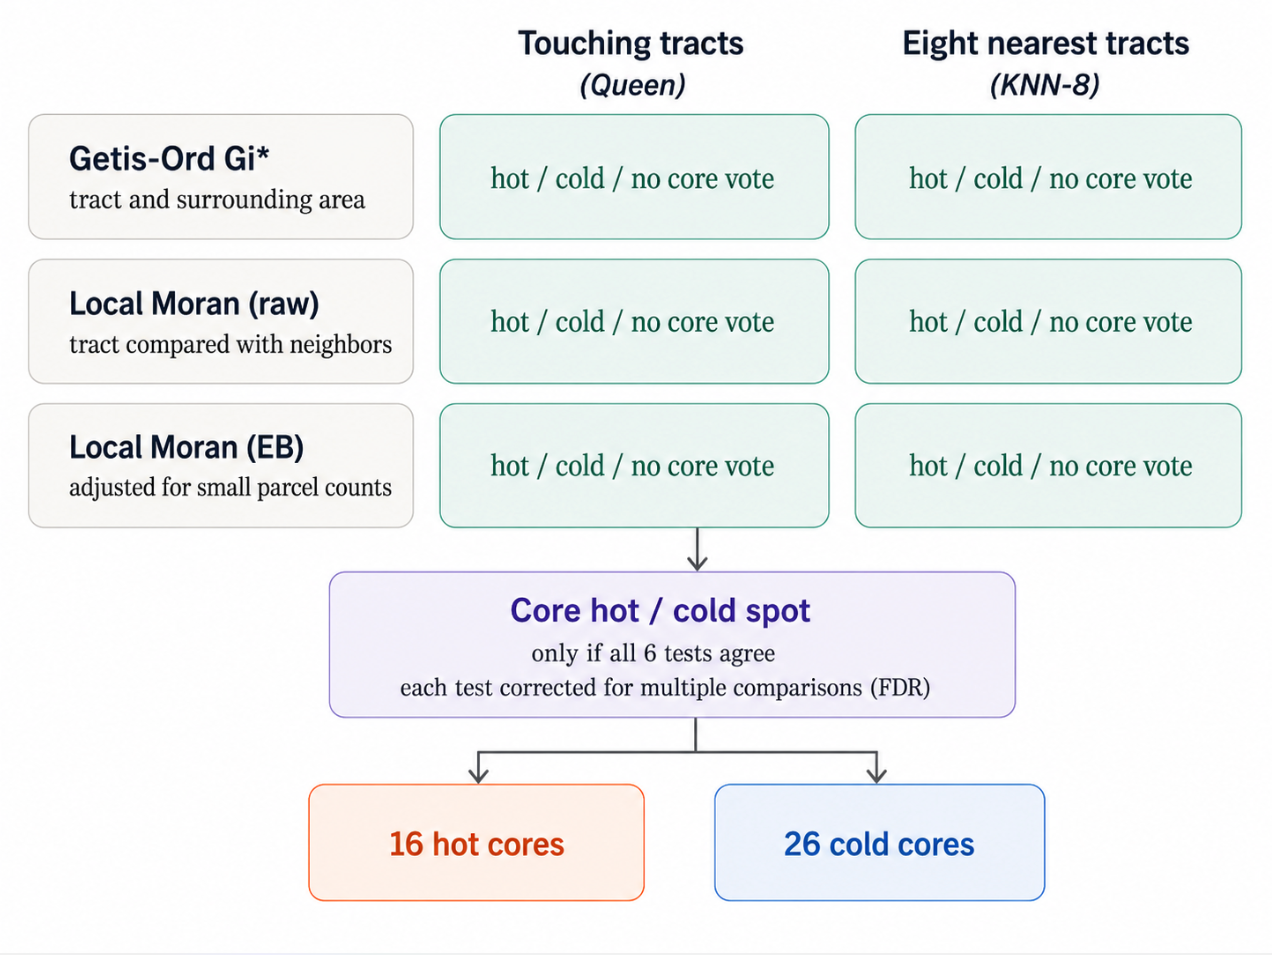
To find those concentrations, the region was divided into census tracts, small statistical areas that approximate neighborhoods, and the heirs-property rate in each tract was compared with rates of other nearby tracts. Because there is no single correct way to define “nearby,” the analysis used two definitions. One, tracts that physically touch along either an edge or a corner, called queen contiguity. And two, eight-nearest-neighbor weighting, or KNN-8, which identifies the eight tracts whose geographic centers are closest to each tract. The KNN-8 network was symmetrized, meaning two tracts were treated as neighbors if either one selected the other; as a result, each tract had between eight and fifteen neighbors.
Three spatial tests were run under both definitions of “neighbor.” These were Getis-Ord Gi*, Local Moran’s I using the raw heirs-property rate, and Local Moran’s I with an Empirical Bayes rate adjustment. Getis-Ord Gi* evaluates whether the combined rate across a tract and its neighbors is unusually high or low for the region. Local Moran’s I compares each tract’s rate with the average of its neighbors, distinguishing high-rate tracts surrounded by high rates and low-rate tracts surrounded by low rates, while also identifying spatial outliers that do not follow their surroundings. Together, they asked whether high or low values were gathering in the same places and whether each tract resembled the areas around it. One version also adjusted for the greater instability of rates calculated from smaller numbers of parcels. The Empirical Bayes version used each tract’s flagged-parcel count and total parcel count directly and applied an Assunção–Reis adjustment, reducing the risk that an unusually high rate based on a very small number of parcels would be mistaken for a cluster.
The analysis then tested how easily those patterns could have appeared through chance. Results were compared with 99,999 random rearrangements of the data, and the statistical threshold was tightened to account for testing many places at once. Specifically, each set of 258 tract-level tests was corrected using the Benjamini–Hochberg false-discovery-rate procedure at a 5% threshold. Additional checks examined whether the findings changed when neighbors were defined differently, when small-area rates were adjusted, or when only the study’s highest-confidence parcel classifications were used.
A tract was ultimately labeled a core hot or cold spot only when all six test combinations agreed. This rule, deliberately conservative, identified 16 hot cores and 26 cold cores across the study area. A separate parcel-level test held all 381,852 parcel locations and tract sizes fixed, then randomly reassigned all 8,091 flagged-property labels across them in 99,999 multivariate-hypergeometric draws. All 16 hot cores and all 26 cold cores remained classified in the same direction under both definitions of neighbors.
Data Conventions
Two conventions run through every published number, and two smaller ones are noted in the footnotes.10
- Multi-lot assessments are counted once. Some properties span several recorded lots, and the assessor repeats one combined assessed value on every lot’s row. Summed naively, a single assessment would be counted once per lot; one 21-lot property in the study area would be counted twenty-one times over. Value summaries collapse each such group to a single assessment before any median or total is computed.
- Census tracts are re-derived from coordinates. Each parcel’s census tract was recomputed by locating the parcel’s coordinates within tract boundaries. Rather than trust assessor data to correctly sort parcels by census geography, the study re-derived each parcel’s tract and block group based on its coordinates, constrained to the parcel’s own jurisdiction. The constraint mattered particularly at county lines, where a mapped point that drifted across a boundary would otherwise pull in a neighboring county’s tract.
What the Index Cannot Tell Us
- It is an index, not a title determination. The design-stage deed spot check described above supported the index’s logic, but no statistically representative sample of the final flagged population has been taken through a full title search, so the share of flagged parcels that would survive one is unmeasured.
- The screening process may miss properties whose ownership problems are not visible in administrative records. Equally, the flagged total is an estimate rather than a confirmed count.
- Tract-level findings are regional-context dependent. The inequity results are measured on tract aggregates, and cannot speak to any individual owner’s race or income.
- The death-suppression signal, which accounts for most flagged parcels, rests on a single commercial death registry whose own error rate is not published.
Limitations
- The index is only as good as the assessor data beneath it. ReGrid consolidates each county’s assessment roll as the county last refreshed it, and those refresh dates range from 2023 to 2026 across the six jurisdictions. A property sold, probated, or re-assessed after its county’s refresh date appears in this study in its earlier state.
Assessor data can be inconsistent. Some fields are missing in every county file, and a signal that cannot be read is treated as absent. Incomplete inputs therefore suppress signals and push the totals down. Earlier heirs’ property research working from tax-assessment data reported the same behavior. Accordingly, estimates from these methods run conservative.11
Protecting Information
Research on heirs’ property presents a specific data governance problem. The same information that can help legal-service providers understand where assistance is needed can also be used to identify families or properties in vulnerable ownership conditions. Because heirs’ property can expose families to speculative acquisition, partition actions, and involuntary land loss, this study follows a do-no-harm approach to public reporting.12
- Parcel addresses, owner names, and parcel-level classifications are not published or shared with anyone who is not directly involved in the analysis.
- Neighborhood results are generalized through ranges and suppression rules rather than exact tract-level values where disclosure risk is higher. Tracts with fewer than 5 flagged parcels or fewer than 100 total parcels are suppressed.
- Public maps are designed to show regional patterns and guide outreach, not to identify individual properties that may have tangled title.
These protections necessarily obscure some detail that might otherwise be useful to the public. That tradeoff is intentional. A detailed list or map of properties believed to have unresolved title could support legitimate outreach, but it could also be used for purposes contrary to the study, including identifying potentially vulnerable properties for speculative acquisition.
Public reporting therefore uses the minimum level of geographic detail needed to explain the findings while withholding information that could expose individual families. The goal is to produce enough information to support legal assistance, policy, and public understanding without turning a research tool into a means of locating vulnerable owners.
The use of this data or any research herein to further real estate speculation on heirs’ property is explicitly prohibited.
Data Sources
- Parcel records. ReGrid parcel data, Q1 2026, for the six jurisdictions (Chesterfield, Colonial Heights, Henrico, Hopewell, Petersburg, Richmond City).
- Deceased-owner matching. A commercial deceased-suppression service whose database is built around the Social Security Administration’s Death Master File.
- Deed spot check. Virginia circuit court land records accessed through the Secure Remote Access (SRA) system (Richmond City, Henrico, Chesterfield).
- Owner status signals. Derived from public records and commercial data services matched at the parcel level.
- Demographics. American Community Survey 5-year estimates, tract level.
- Historical lending grades. 1930s Home Owners’ Loan Corporation (HOLC) grades for Richmond and the 1937 Petersburg category map, from Mapping Inequality, University of Richmond.
Analysis by HDAdvisors in support of the Richmond Heirs Property Network, 2026.
Footnotes
Sarah Stein and Ann Carpenter, “Heirs’ Property in an Urban Context,” Federal Reserve Bank of Atlanta (2022); and G. Rebecca Dobbs and Cassandra Johnson Gaither, “How Much Heirs’ Property Is There? Using LightBox Data to Estimate Heirs’ Property Extent in the United States,” Journal of Rural Social Sciences 38, no. 1 (2023).↩︎
Garrett Hincken, How ‘Tangled Titles’ Affect Philadelphia, The Pew Charitable Trusts (August 2021), https://www.pewtrusts.org/-/media/assets/2021/08/tangledtitlesphilly_report_final.pdf.↩︎
Hincken, How ‘Tangled Titles’ Affect Philadelphia.↩︎
Ryan Thomson and Conner Bailey, “Identifying Heirs’ Property: Extent and Value Across the South and Appalachia,” Journal of Rural Social Sciences 38, no. 1 (2023): 29–38, https://open.clemson.edu/jrss/vol38/iss1/5. Thomson and Bailey developed a four-variable index from CoreLogic property-tax records covering eleven Southern and Appalachian states. The variables were ownership-rights codes, a “care of” owner listing, effective year built, and time since the last sale. Ownership-rights evidence received two points and each remaining indicator received one; parcels scoring at least three of five points were classified as likely heirs’ property. The effective-year-built measure referred to the date of major permitted improvements rather than the structure’s original construction.↩︎
The differences in brief. Death is measured, not inferred: Thomson and Bailey read heirs’ status primarily from how ownership is written in the tax record, while this study checks whether the named owner has actually died, which sits closer to the mechanism that produces heirs’ property in the first place. The corroborating signals are administrative rather than building-related: their index uses an effective-year-built variable as a proxy for the permitted improvements an heirs’ property is less likely to receive, while this study looks for evidence that ownership and occupancy have come apart, through vacancy, multiple owners of record, and a mailing address away from the property. Classification is tiered rather than pass/fail: a parcel in their index either crosses the threshold or does not, while this study separates stronger convergent cases from lighter but still meaningful ones, which is more useful for deciding where outreach should go first. And the purpose is different: their index had to behave consistently across millions of rural and urban parcels in eleven states, while this one is calibrated to the quirks of six local assessors and to the practical question of which households may benefit from legal assistance.↩︎
The estate keyword fires only outside the phrase REAL ESTATE, which otherwise floods the signal with property-management companies.↩︎
Additionally, the screen carried particular rules to reflect the parcel stock in this region. Parcels with nine or more owners of record are excluded from the multiple-owner signal, because at that scale the records frequently turned up a condominium or association master parcel. In some cases, stale assessor data meant the number of owners could not be resolved from the record at all. In such cases, the signal was treated as absent rather than guessed. However, such cases were infrequent, amounting to less than 0.3% of the parcel stock.↩︎
Vacancy rates use only parcels with a known yes or no USPS vacancy determination, roughly nine in ten parcels. Parcels with no determination are excluded from the denominator.↩︎
Two candidate signals were designed and rejected. A shared-surname signal, three or more owners sharing a last name, was designed and then dropped: surname changes at marriage make it unreliable for women, and the multiple-owner signal already captures most of what it would have added. A tax-delinquency signal was planned and proved impossible: the tax-amount field is empty in all six county files.↩︎
A small number of parcels, 627 of 381,852, carry no parcel identifier in the assessor data. They remain in the denominator, and the two flagged parcels among them are identified by street address.↩︎
Housing Assistance Council, A Methodological Approach to Estimate Residential Heirs’ Property in the United States.↩︎
Thomas W. Mitchell, “The Heirs’ Property Field: Moving from the Shadows to the Light to Enlightened, Evidence-Based Solutions,” Agricultural and Resource Economics Review 54, no. 3 (2025): 583–95, https://doi.org/10.1017/age.2025.10021.↩︎