Heirs’ Property in the Richmond Region
1. Introduction
What Is an Heirs’ Property?
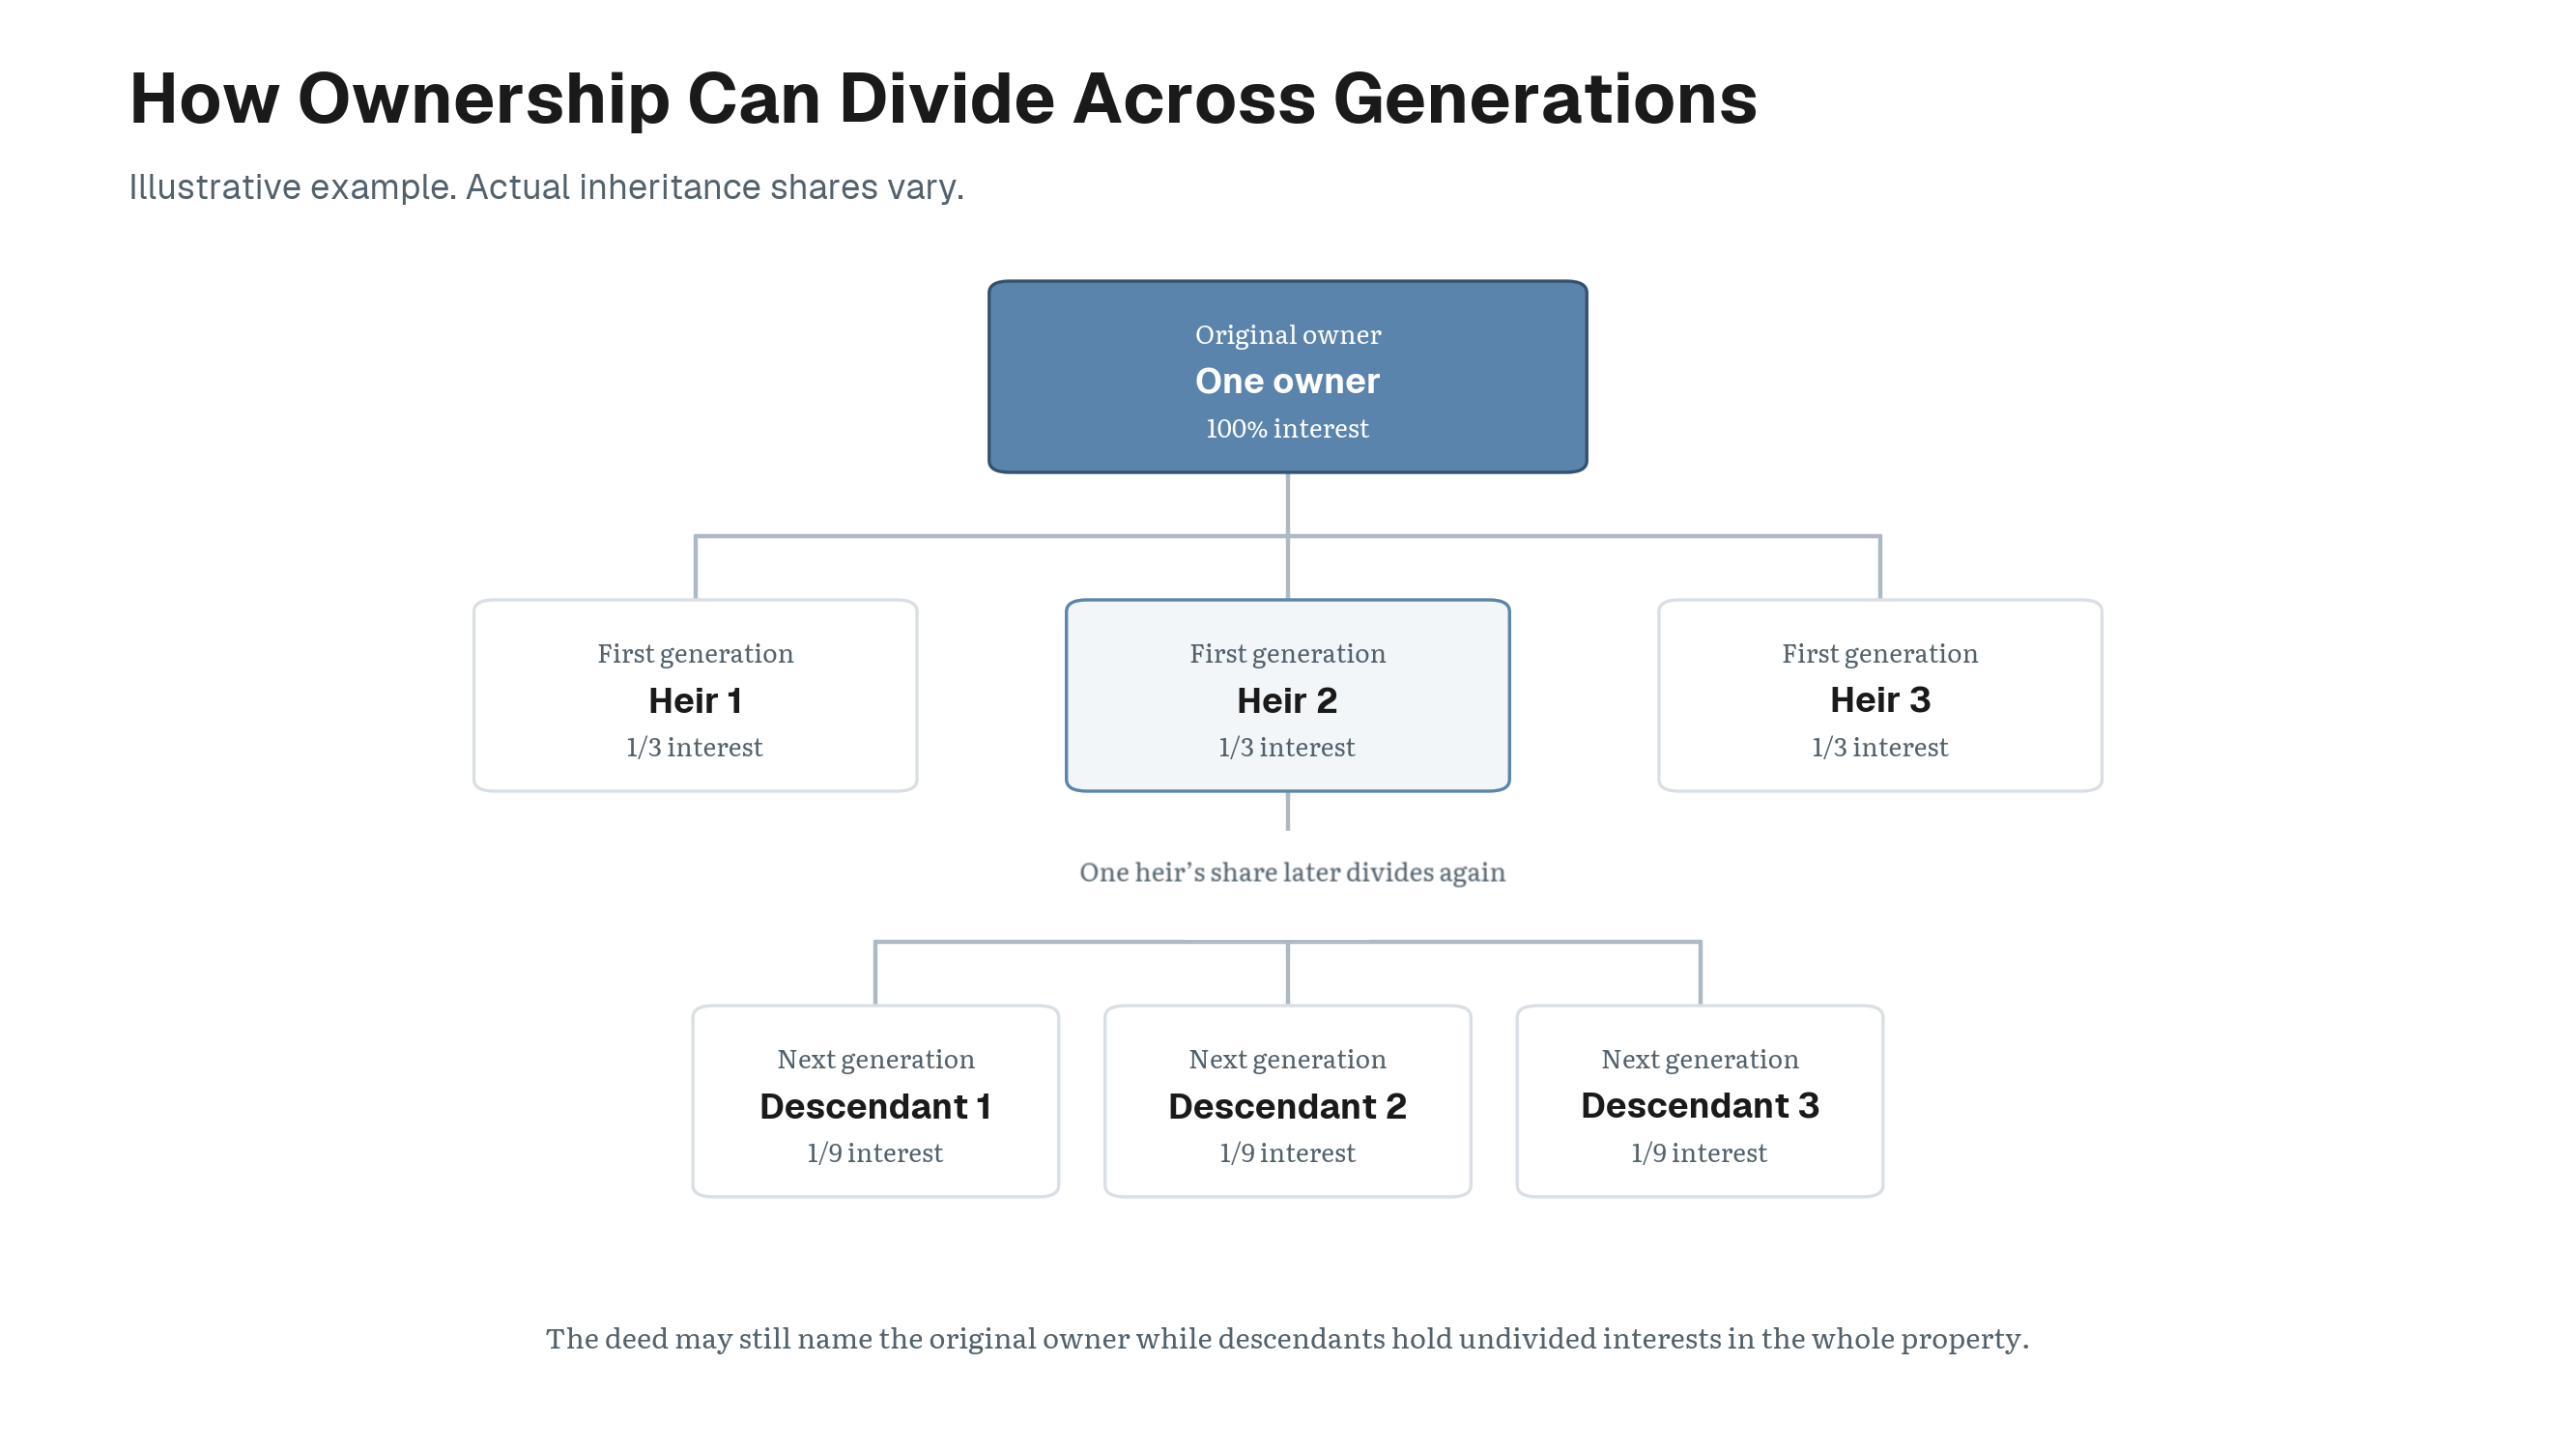
Heirs’ property can arise when an owner dies without a will or a clear transfer of title. Ownership can splinter across descendants while the deed remains unchanged.1 Family members may legally inherit an interest in the property, a shared arrangement known as tenancy in common, without holding the clear title needed to manage it.
Without a clear title, families may struggle to sell or refinance the home, borrow against it for repairs, obtain disaster-recovery assistance, or pass it cleanly to the next generation.2 In Virginia, even someone holding a small fractional interest may seek to divide or force the sale of the property, possibly displacing current residents or placing the home at risk of purchase by real estate investors.3
Left unresolved, heirs’ property can stunt generational wealth, especially for African American and working class families, as property becomes difficult to keep, cutting families off from many of the basic benefits of homeownership and opening pathways to involuntary land loss.
Because heirs’ property is a legal condition that parcel records do not directly identify, it cannot be confirmed from administrative data alone. This study therefore screens for patterns consistent with unresolved inherited ownership so outreach and legal review can be focused where they may be most useful.
The Richmond Heirs Property Network is a program run by HDAdvisors that connects Richmond-region families with free legal assistance to prevent and resolve heirs’ property. This study is intended to help direct that outreach toward communities where unresolved title may be most concentrated, and spotlight challenges to building generational wealth for Black families.
2. What Is This Study?
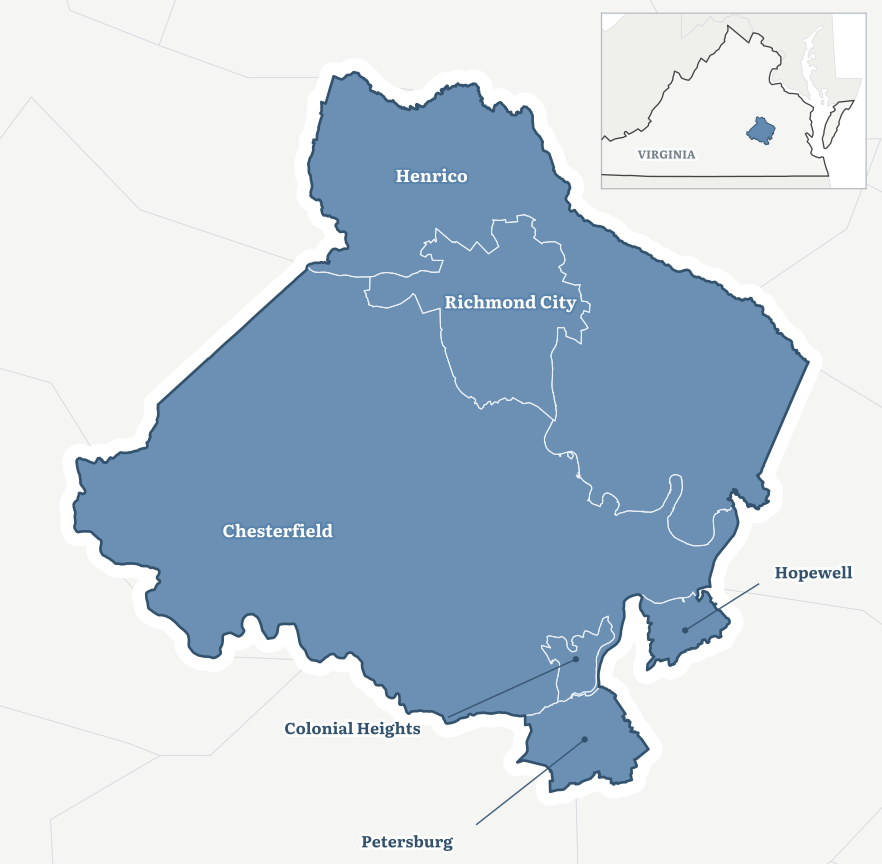
In an effort to better understand the landscape of heirs’ properties in Central Virginia, this study examines parcels showing signs of tangled or unresolved title concentrated across six jurisdictions.
The study covers the cities of Richmond, Petersburg, Colonial Heights, and Hopewell, along with Henrico and Chesterfield counties.
3. Map of Heirs’ Properties
Key Question
How many properties show elevated heirs’ property risk across the region, and where are they located?
Across Richmond, Petersburg, Hopewell, Colonial Heights, Chesterfield, and Henrico, the study screened 381,852 parcels for signs of an heirs’ property.
Key Finding
The screen identified 8,091 parcels with elevated heirs’ property risk, combining the high confidence and likely heirs tiers. That is equal to 2.12% of the regional parcel stock, or about one in every 47 parcels.
These results are intended to aid with outreach toward areas where screening signals are more concentrated, not to identify confirmed heirs’ cases.
Throughout the report, “flagged parcel rate” means the share of parcels classified as high confidence or likely by the screening index.
Of those properties, 1,225 were classified as high confidence, meaning several strong indicators pointed toward an unresolved estate. Another 6,866 were classified as likely, meaning the available records showed meaningful but slightly less conclusive evidence.
Together, those 8,091 flagged parcels represent more than $2.1 billion in assessed property value. Nearly four-fifths of the assessed value represented by flagged parcels is tied to occupied family homes.4
Reading the Map
The interactive map beside this text shows where elevated heirs’ property risk is more concentrated across the region. The surface is deliberately blurred rather than drawn with parcel or census-tract boundaries in order to protect identifying information. Darker shading marks where heirs’ property signals are more concentrated, while the right-side panel controls allow comparison with poverty and the share of Black residents.
Moving the pointer summarizes conditions within roughly two kilometers of that location rather than an exact address. The map is intended to guide outreach toward areas where screening signals are more concentrated, not to identify confirmed heirs’ cases.
The map works best on a desktop browser. Open it full screen.
4. What Does a Flagged Property Usually Look Like?
Key Question
What kind of property most often gets flagged as a potential heirs’ property?
The most common flagged property is an ordinary home that appears to have remained in the same family for many years without updated ownership records.
Key Finding
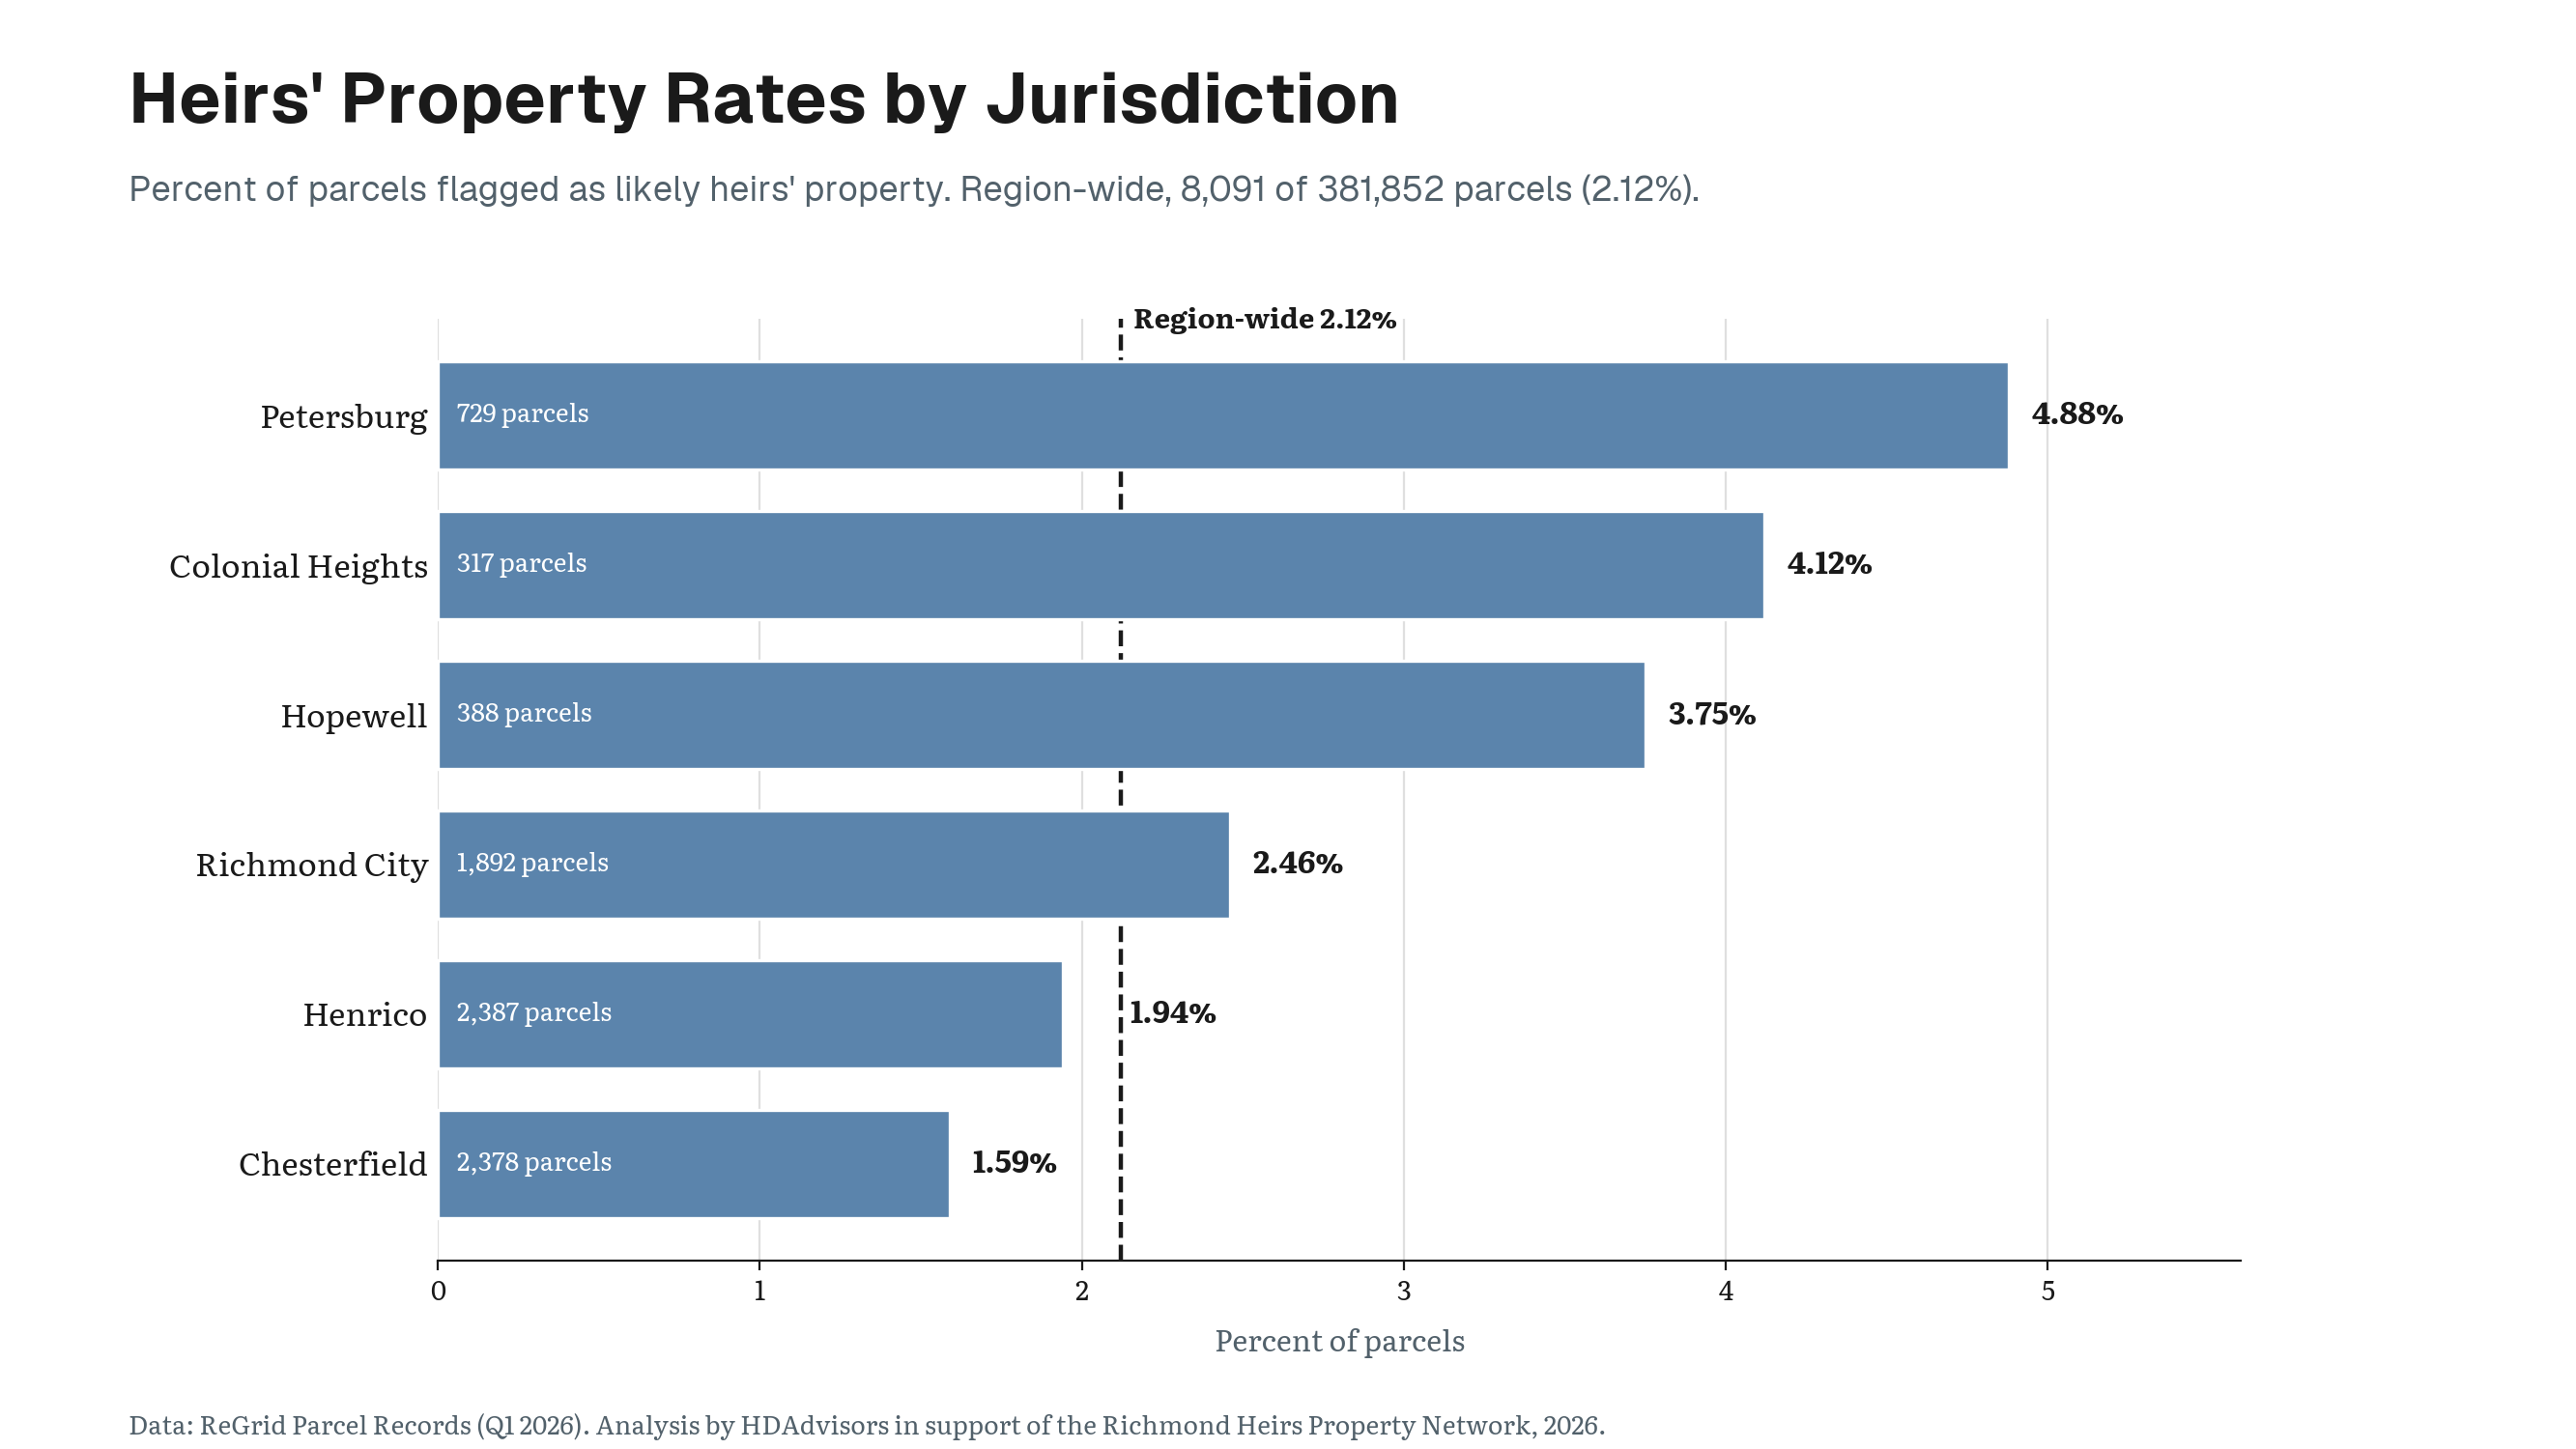
The chart beside this text compares three of the indicators used to identify potential heirs’ properties: a deceased owner of record, long ownership tenure, and an owner whose mailing address differs from the property.
The chart also shows lift, which indicates how unusual each signal is among flagged parcels. A lift of 1 would mean the indicator is no more common among flagged parcels than among all the parcels in the study area. A lift of 2 means the signal appears twice as often among flagged parcels as it does across all parcels. A lift of 35.7 means it appears about 36 times as often.
Most flagged parcels also have only one or two owners listed in the assessor record.
Takeaway
The region’s most common heirs’ property pattern is relatively simple on paper. A deceased person remains named as an owner, the deed has not changed for decades, and the property may still be occupied by family members whose ownership interests were never formally recorded.
5. Flagged Homes vs. Regional Stock
Key Question
How do flagged properties differ from the region’s housing stock overall?
Flagged properties tend to be older, lower-valued, and more likely to be vacant than parcels across the study area as a whole.
Key Finding
USPS vacancy is one of the indicators used by the screening index, but it appears on fewer than one in ten flagged parcels. Most flagged properties are not vacant.
Takeaway
Heirs’ property should not be confused with vacancy. The dominant pattern remains an older, occupied home whose ownership records appear not to have kept pace with changes in the family.
6. Heirs’ Rates Change Sharply Across the Region
Key Question
How much do heirs’ property rates vary across the six localities?
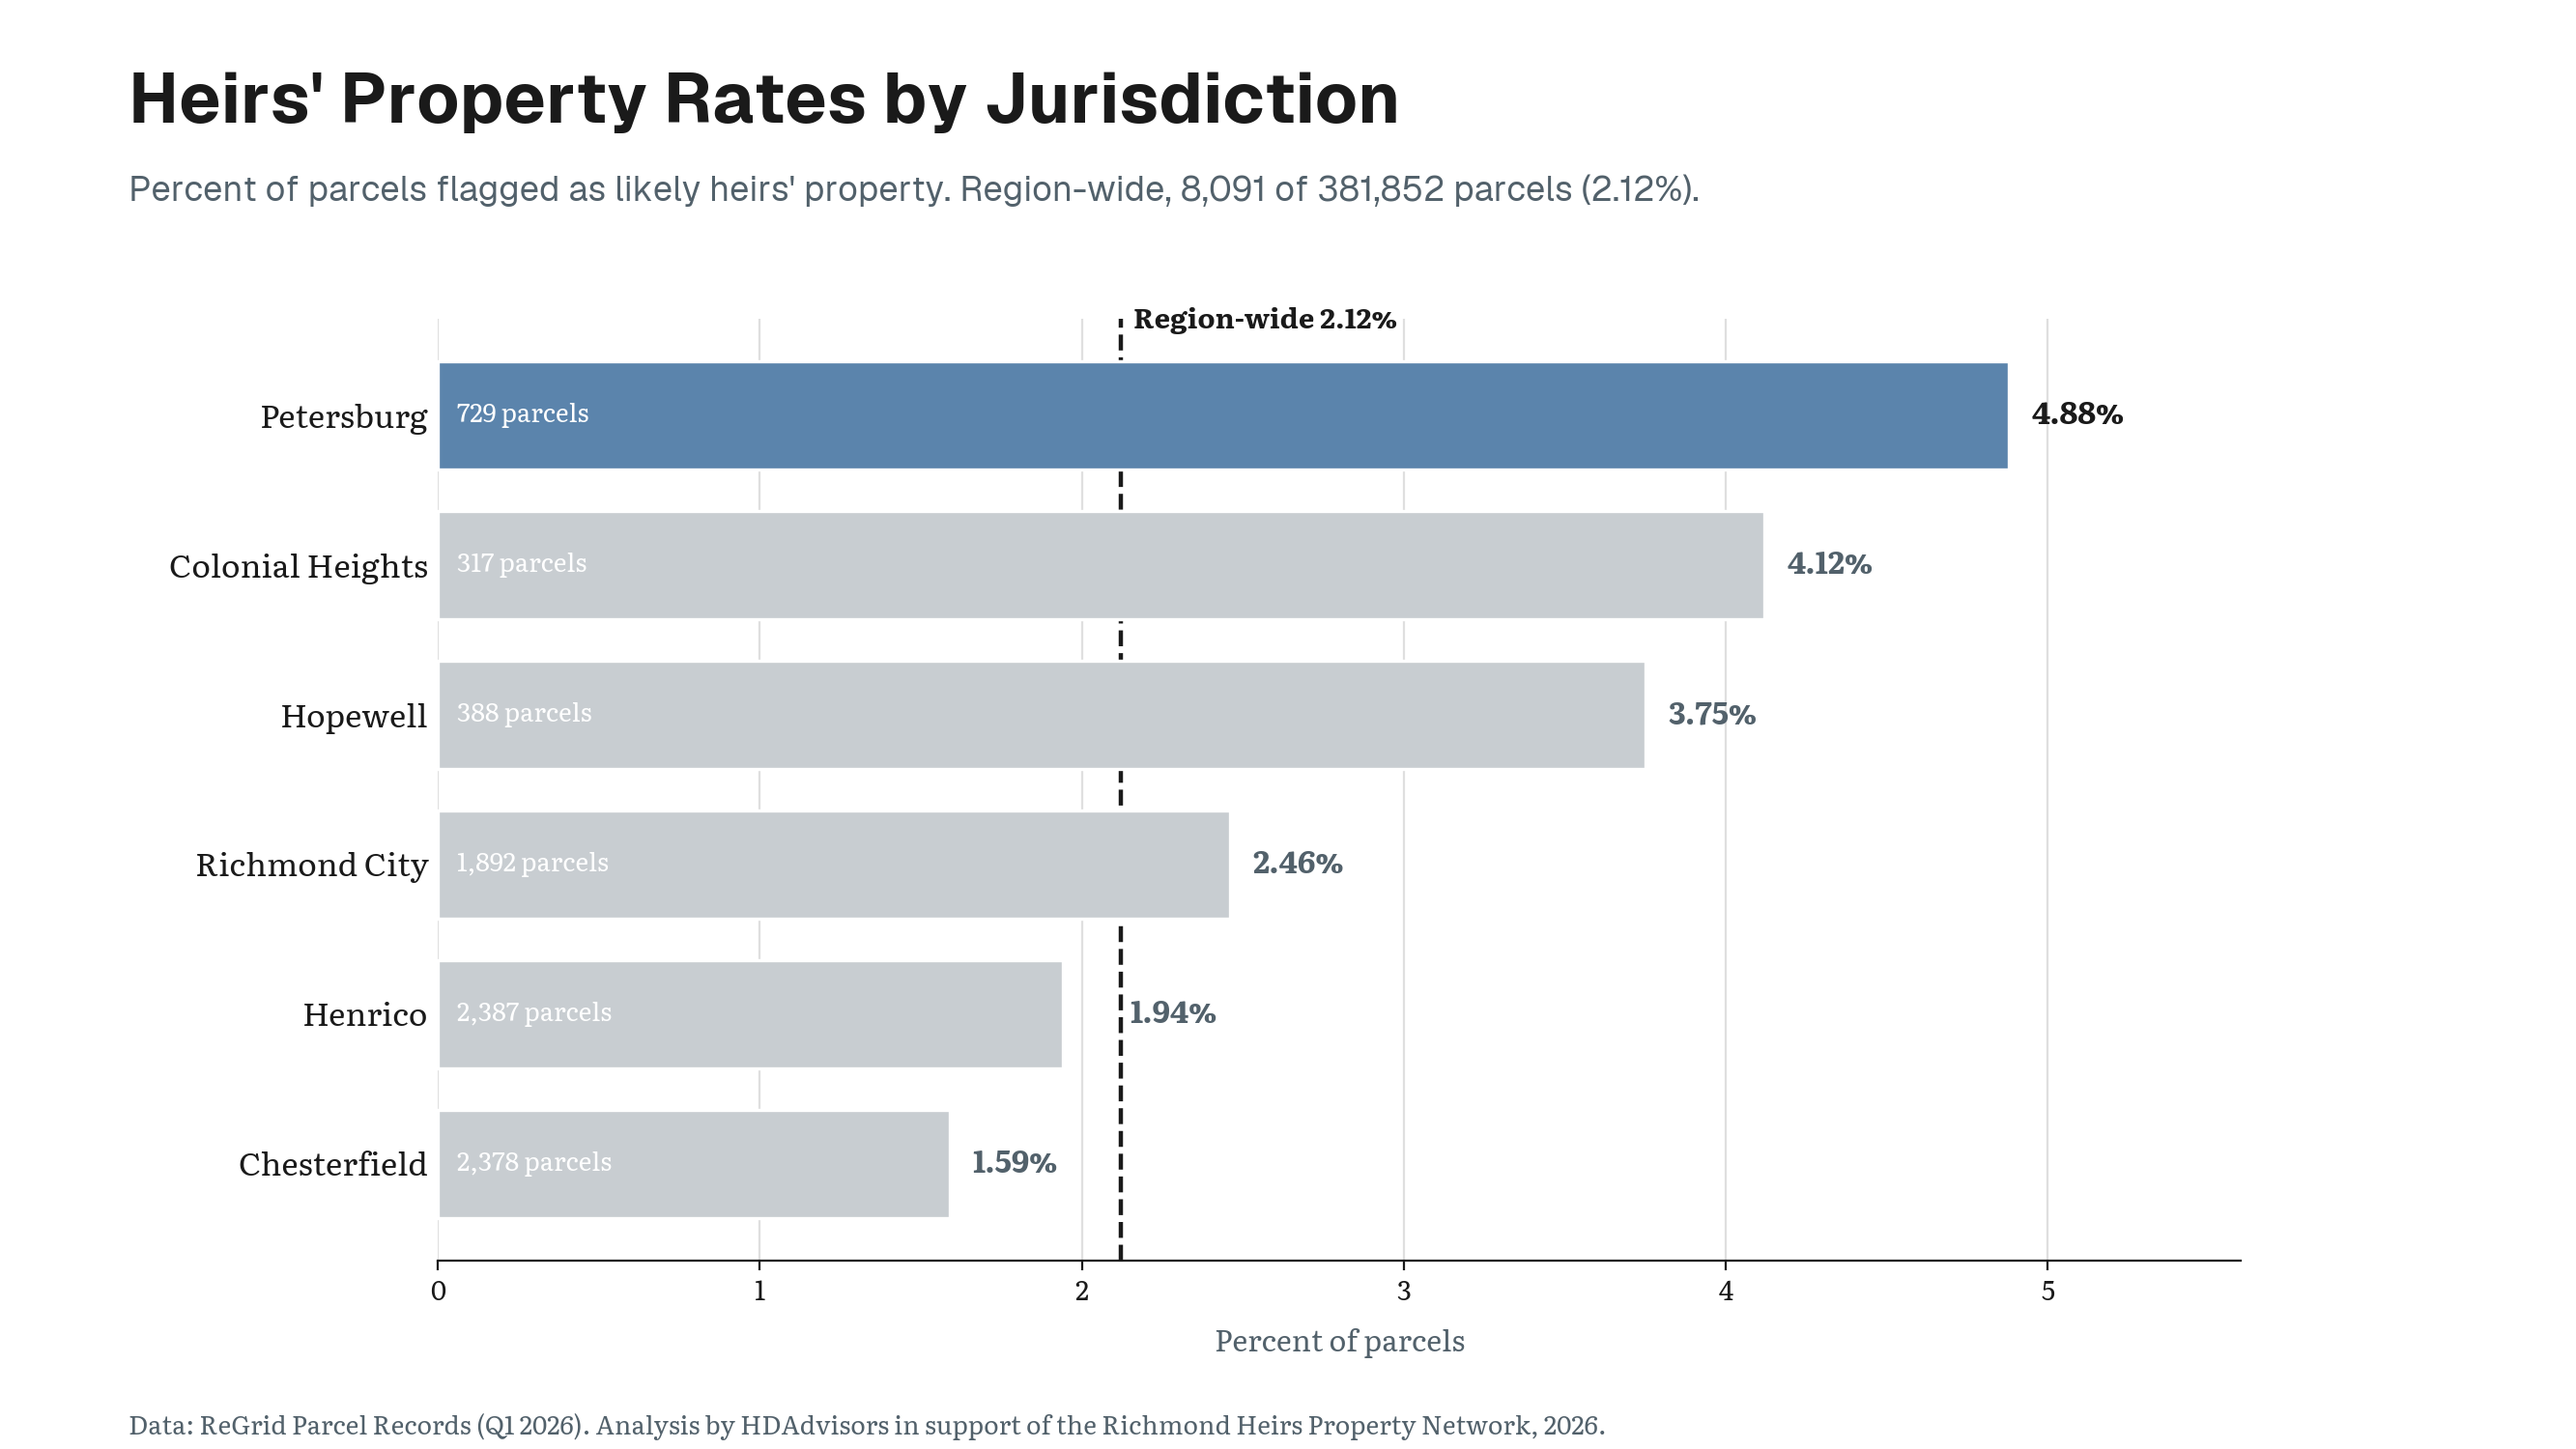
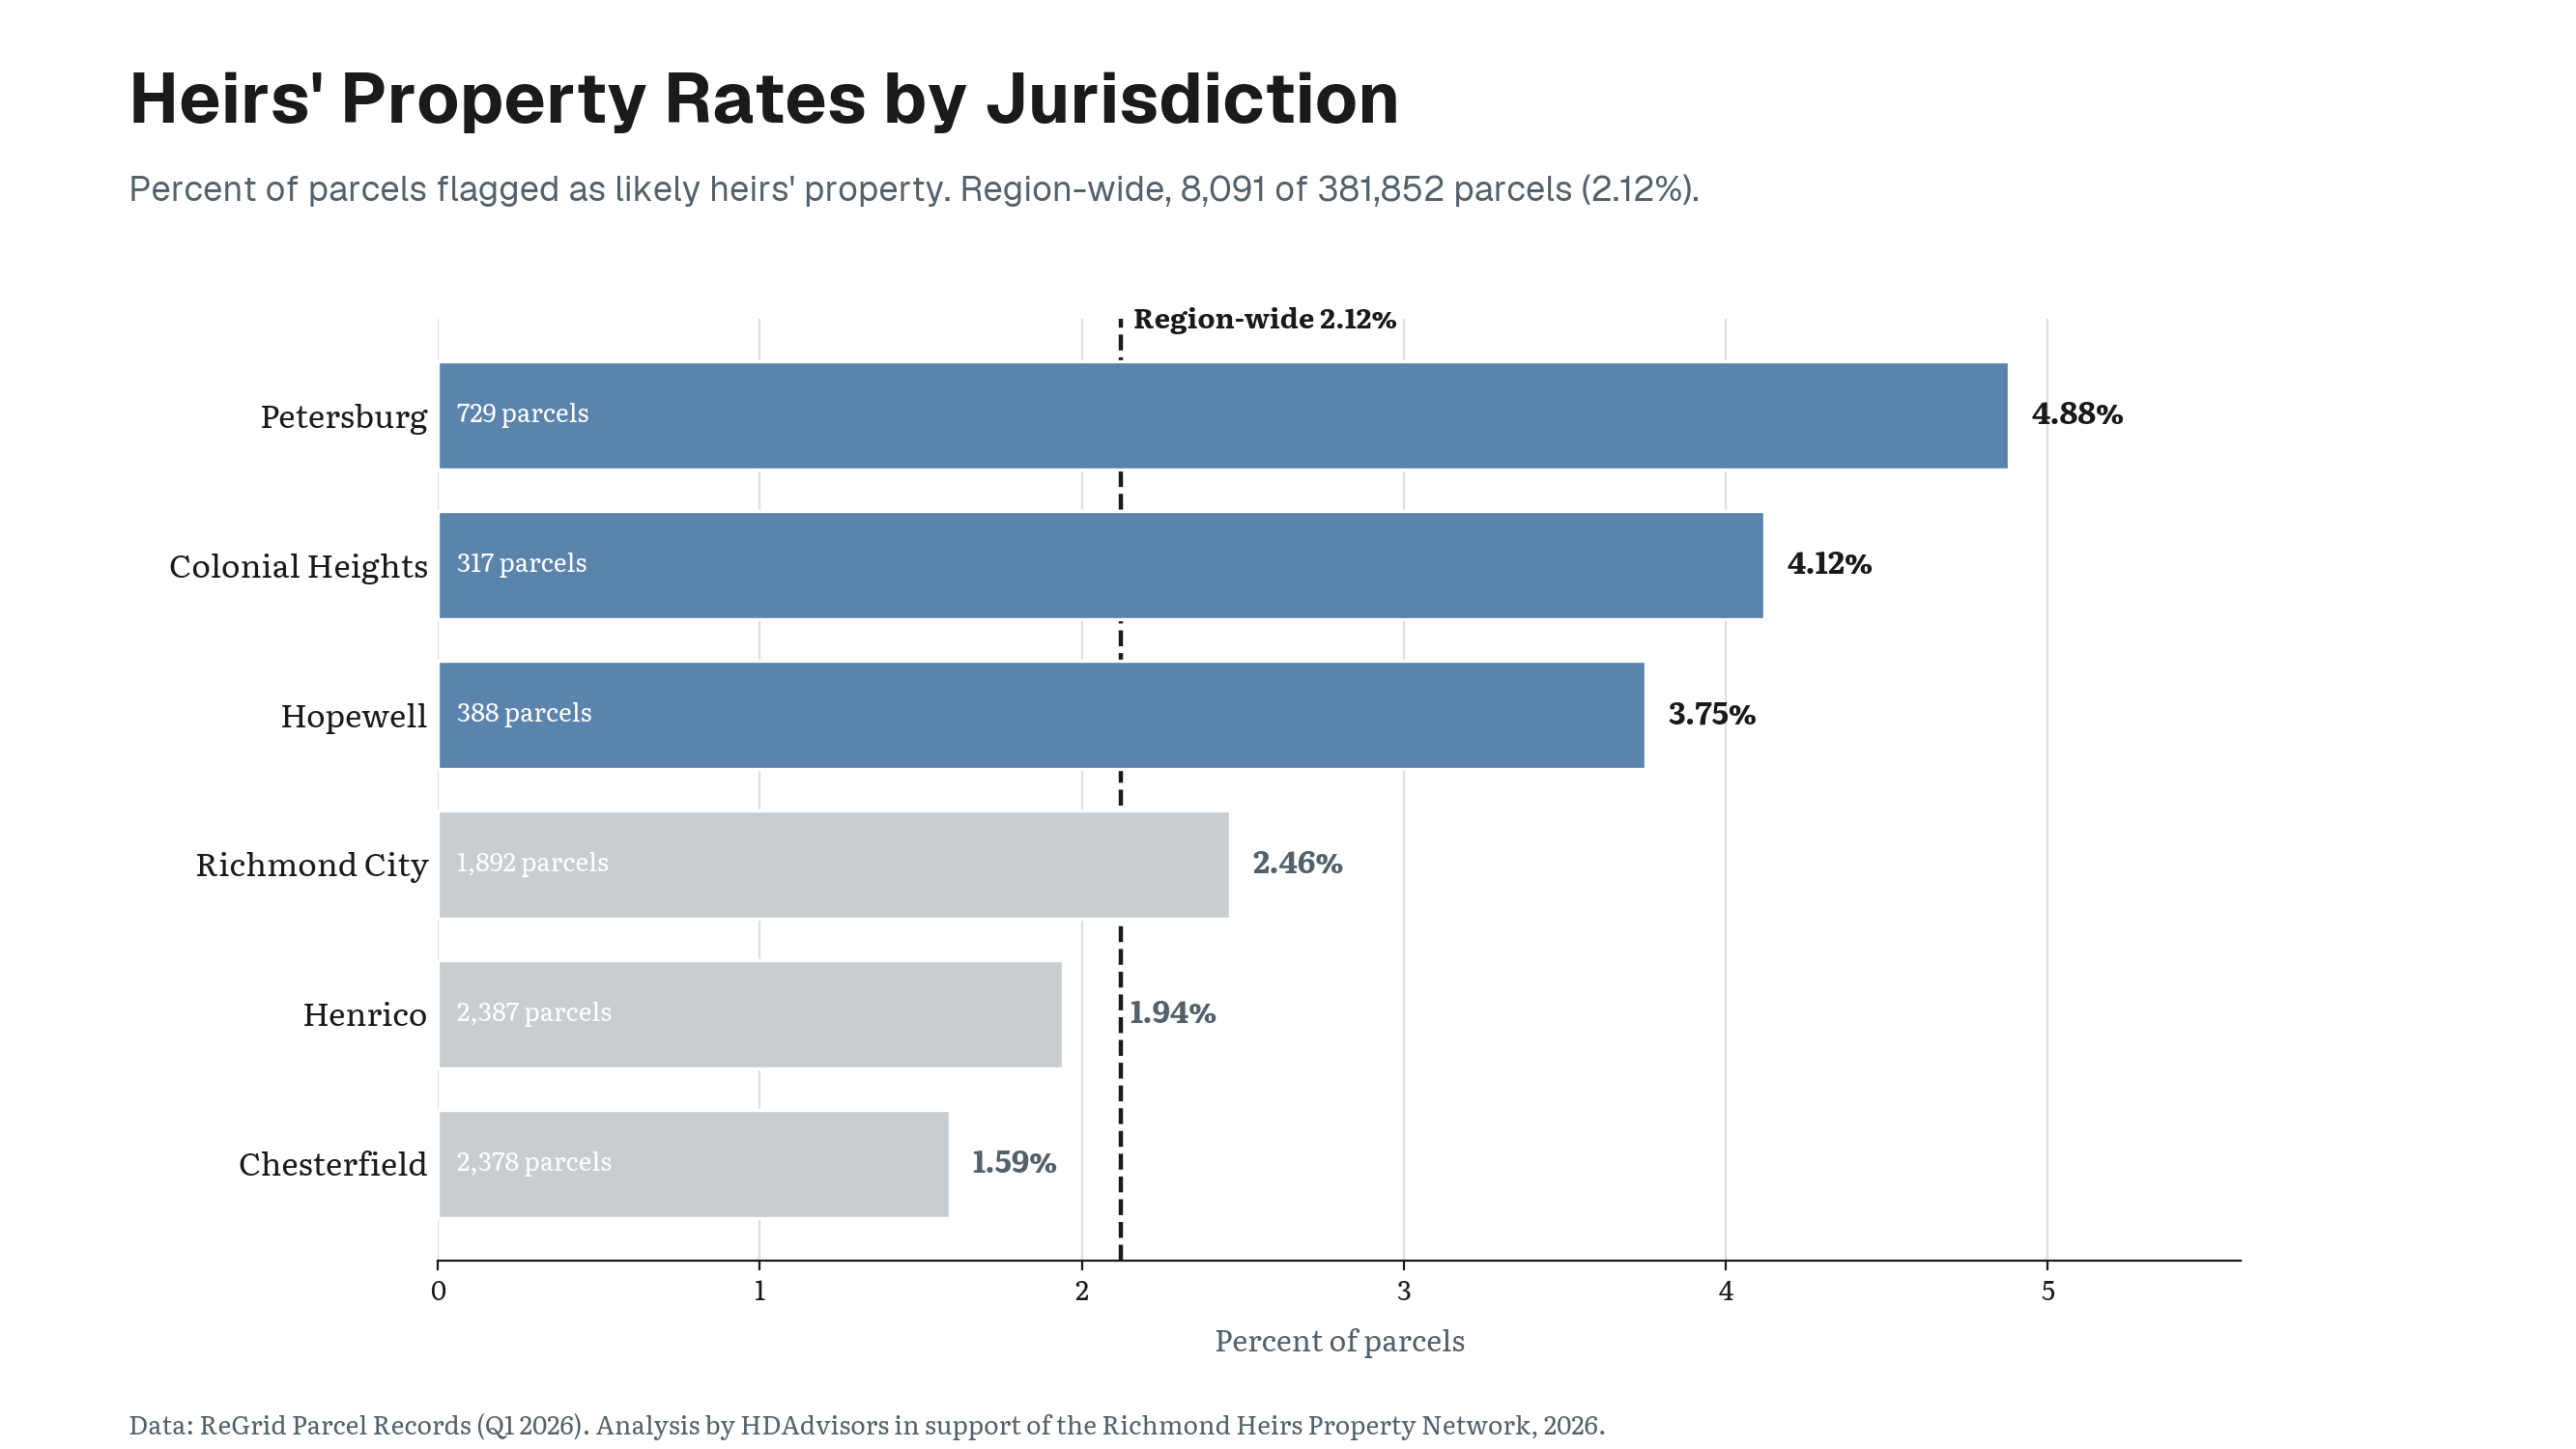
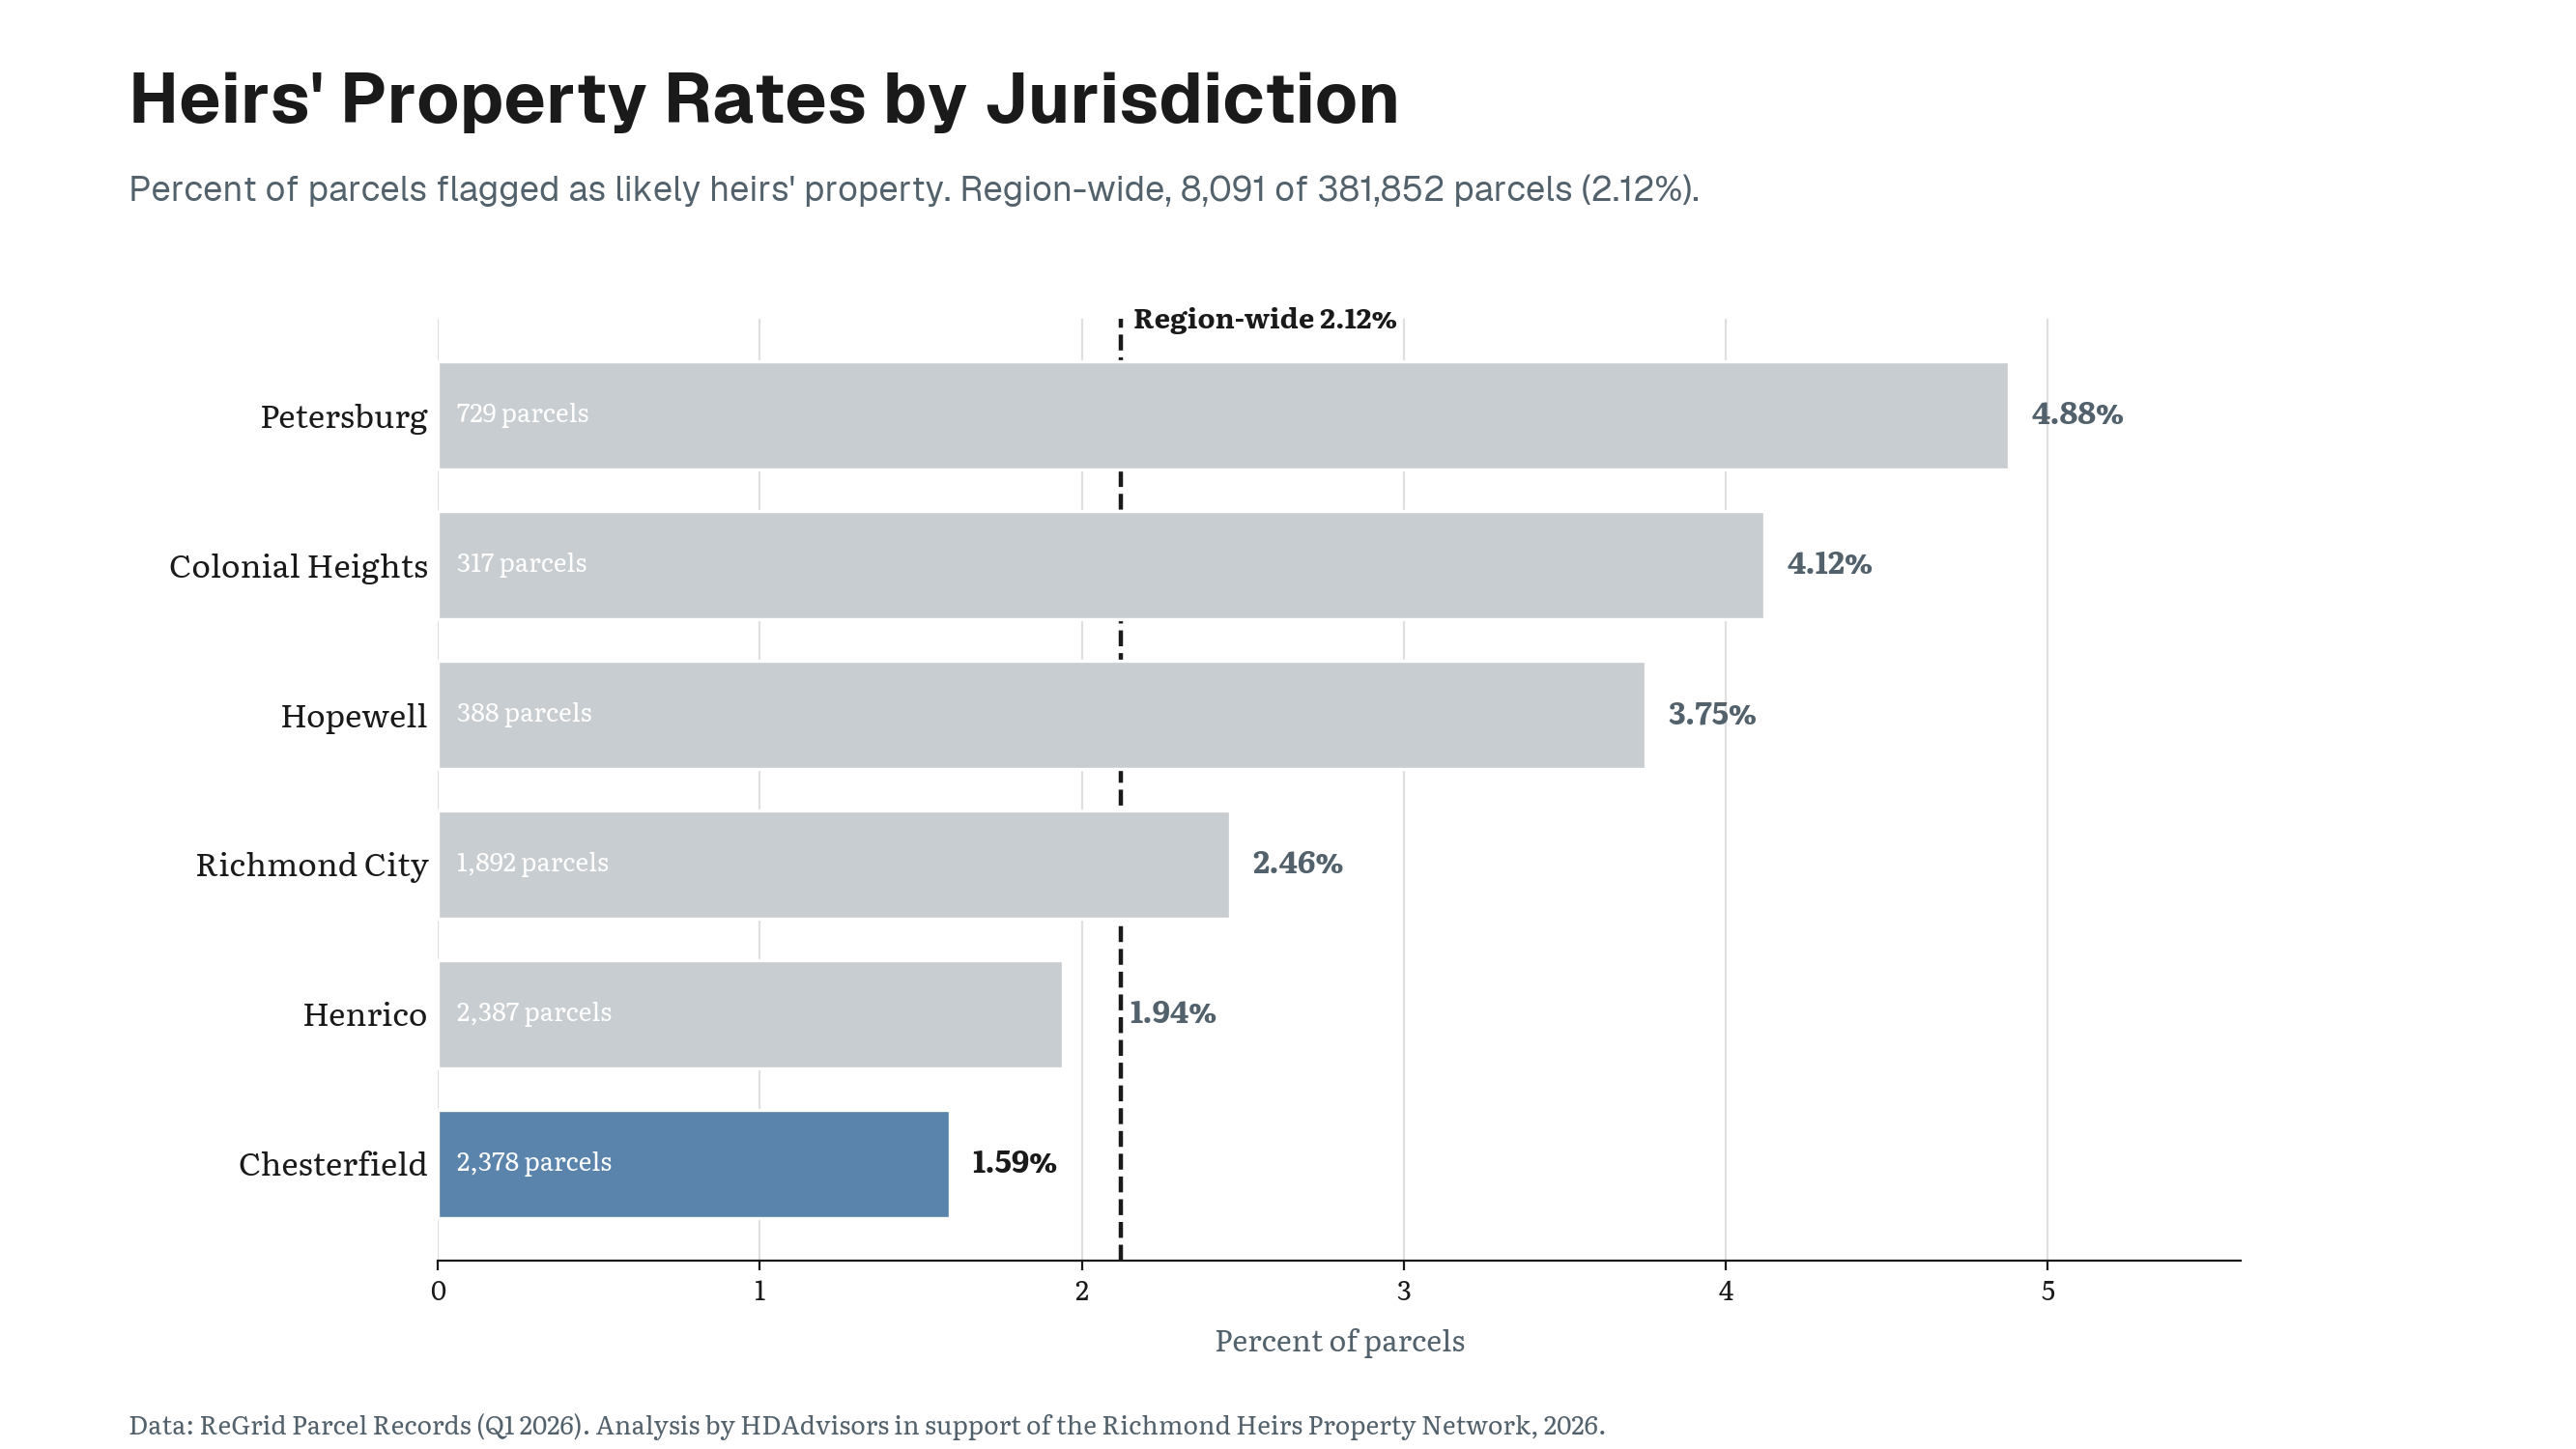
The regional average hides large differences between localities.
Key Finding
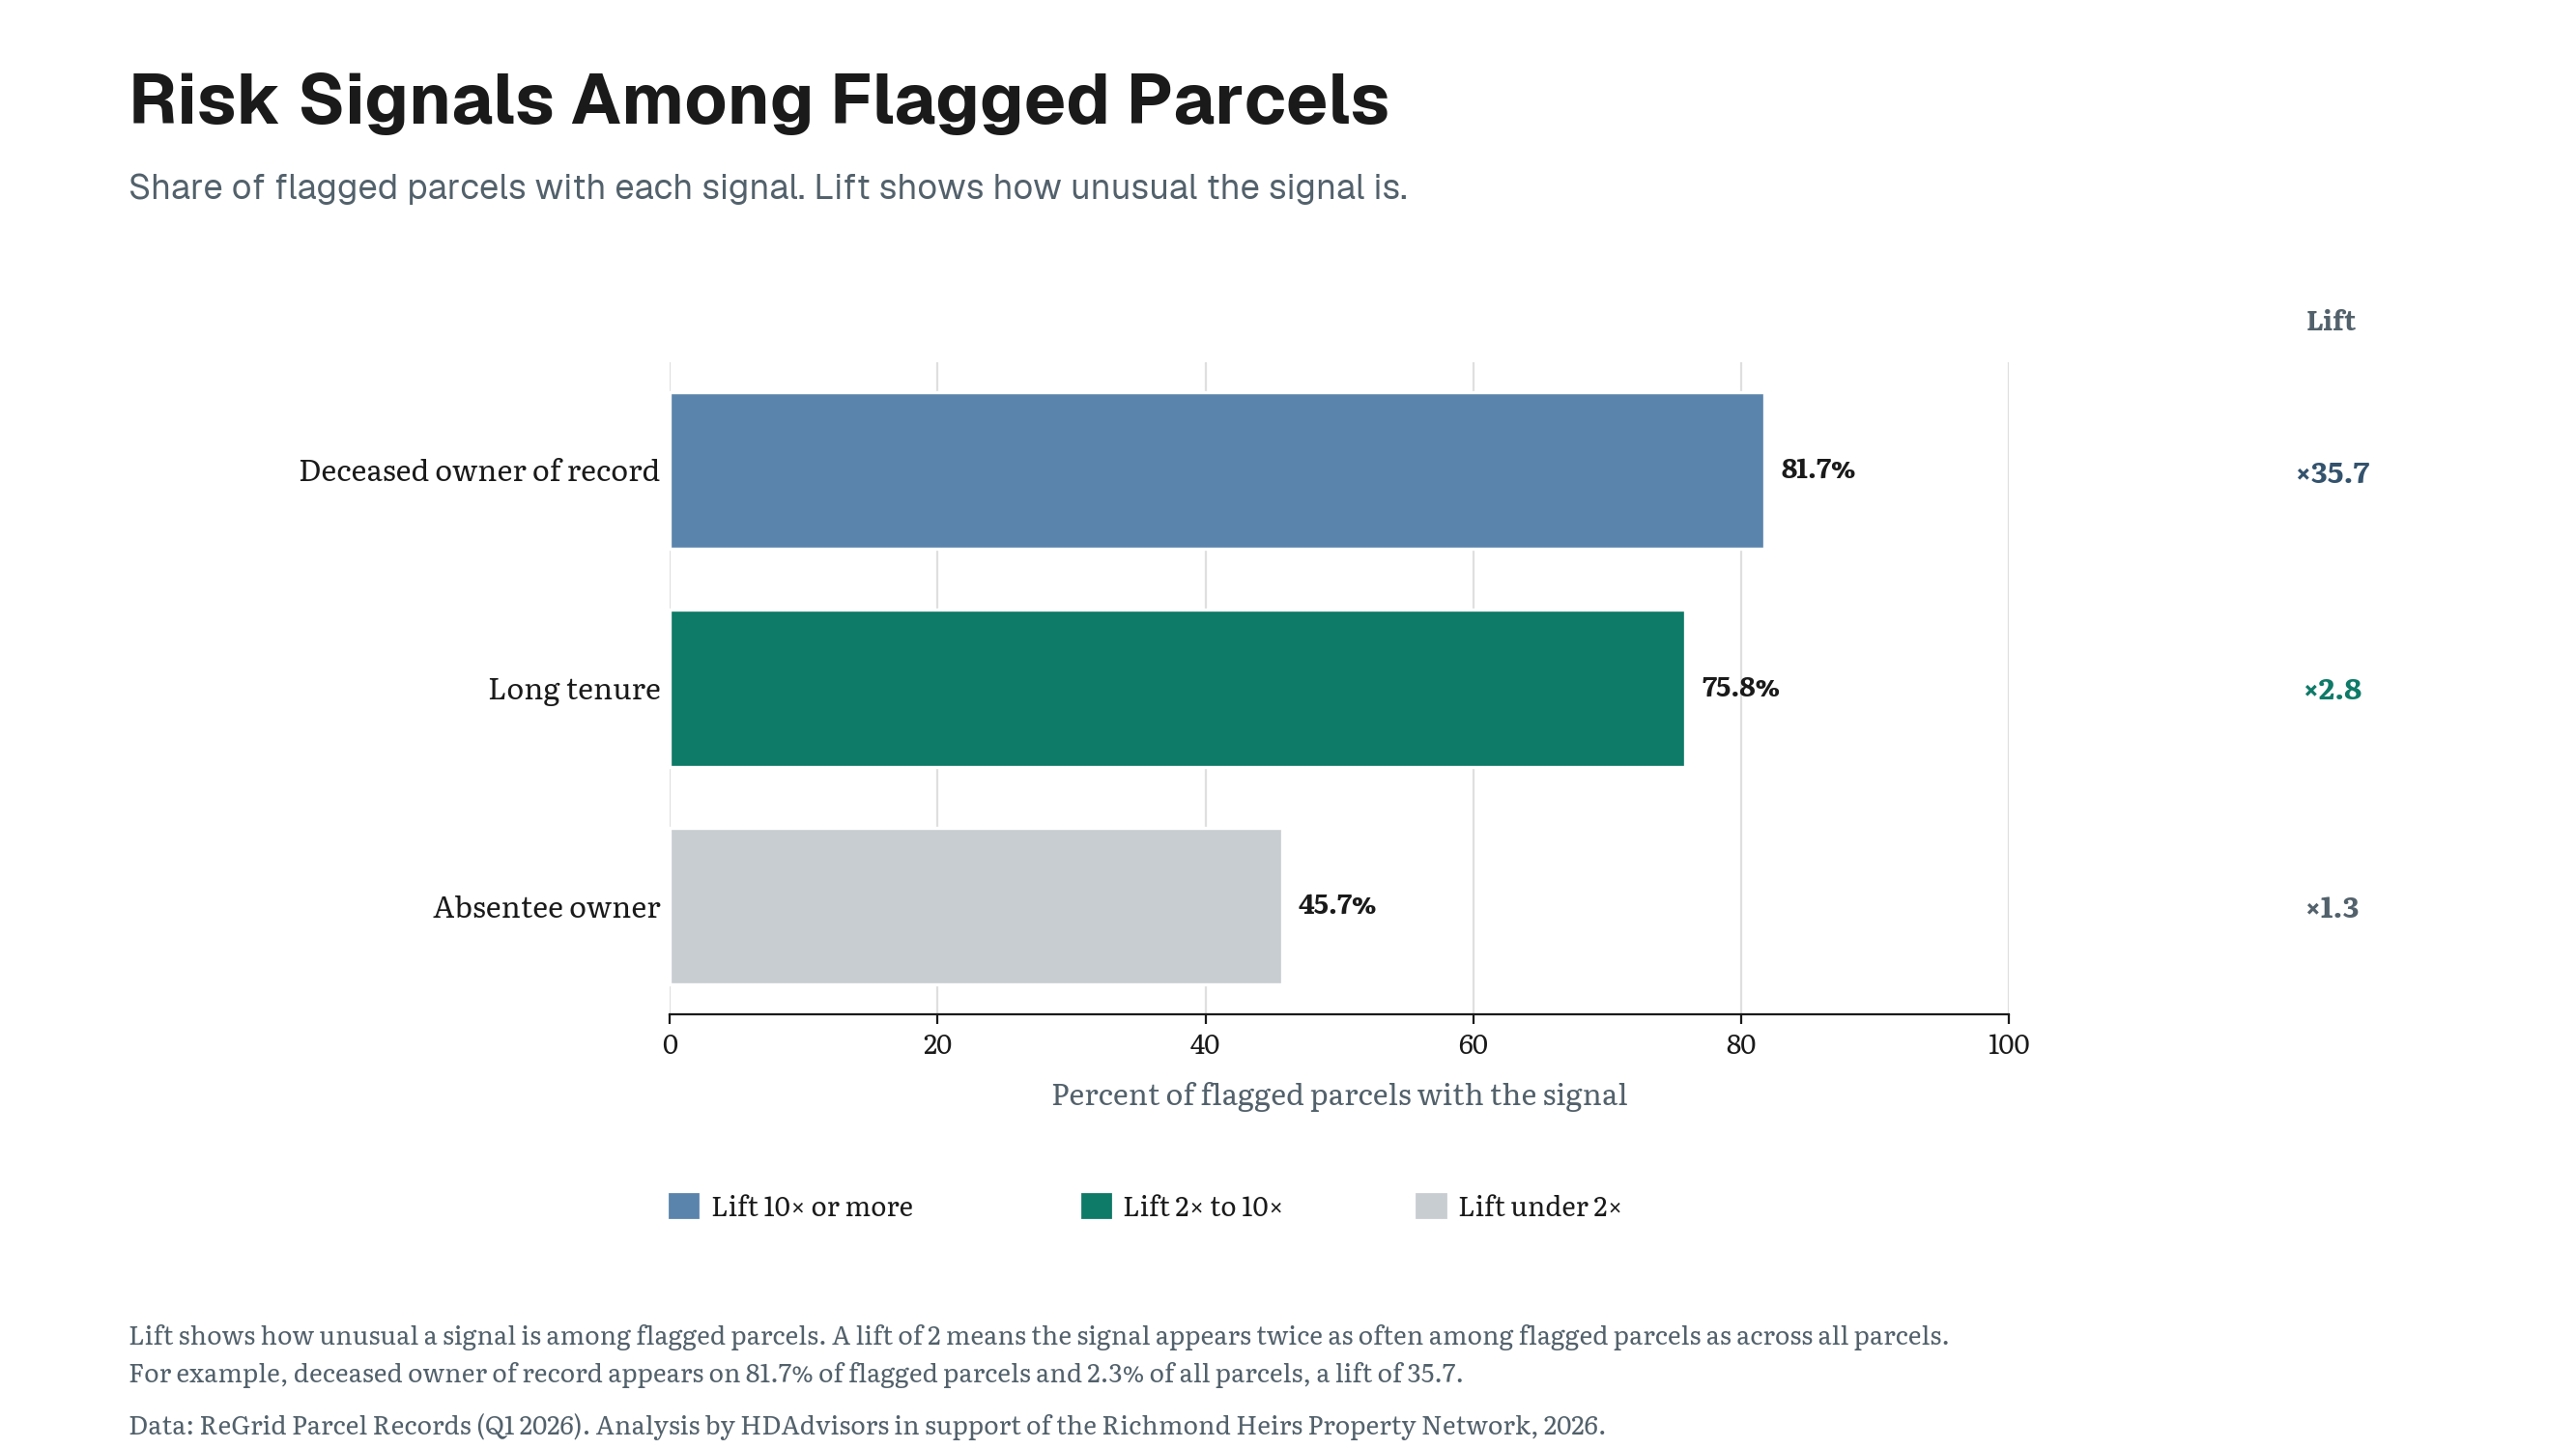
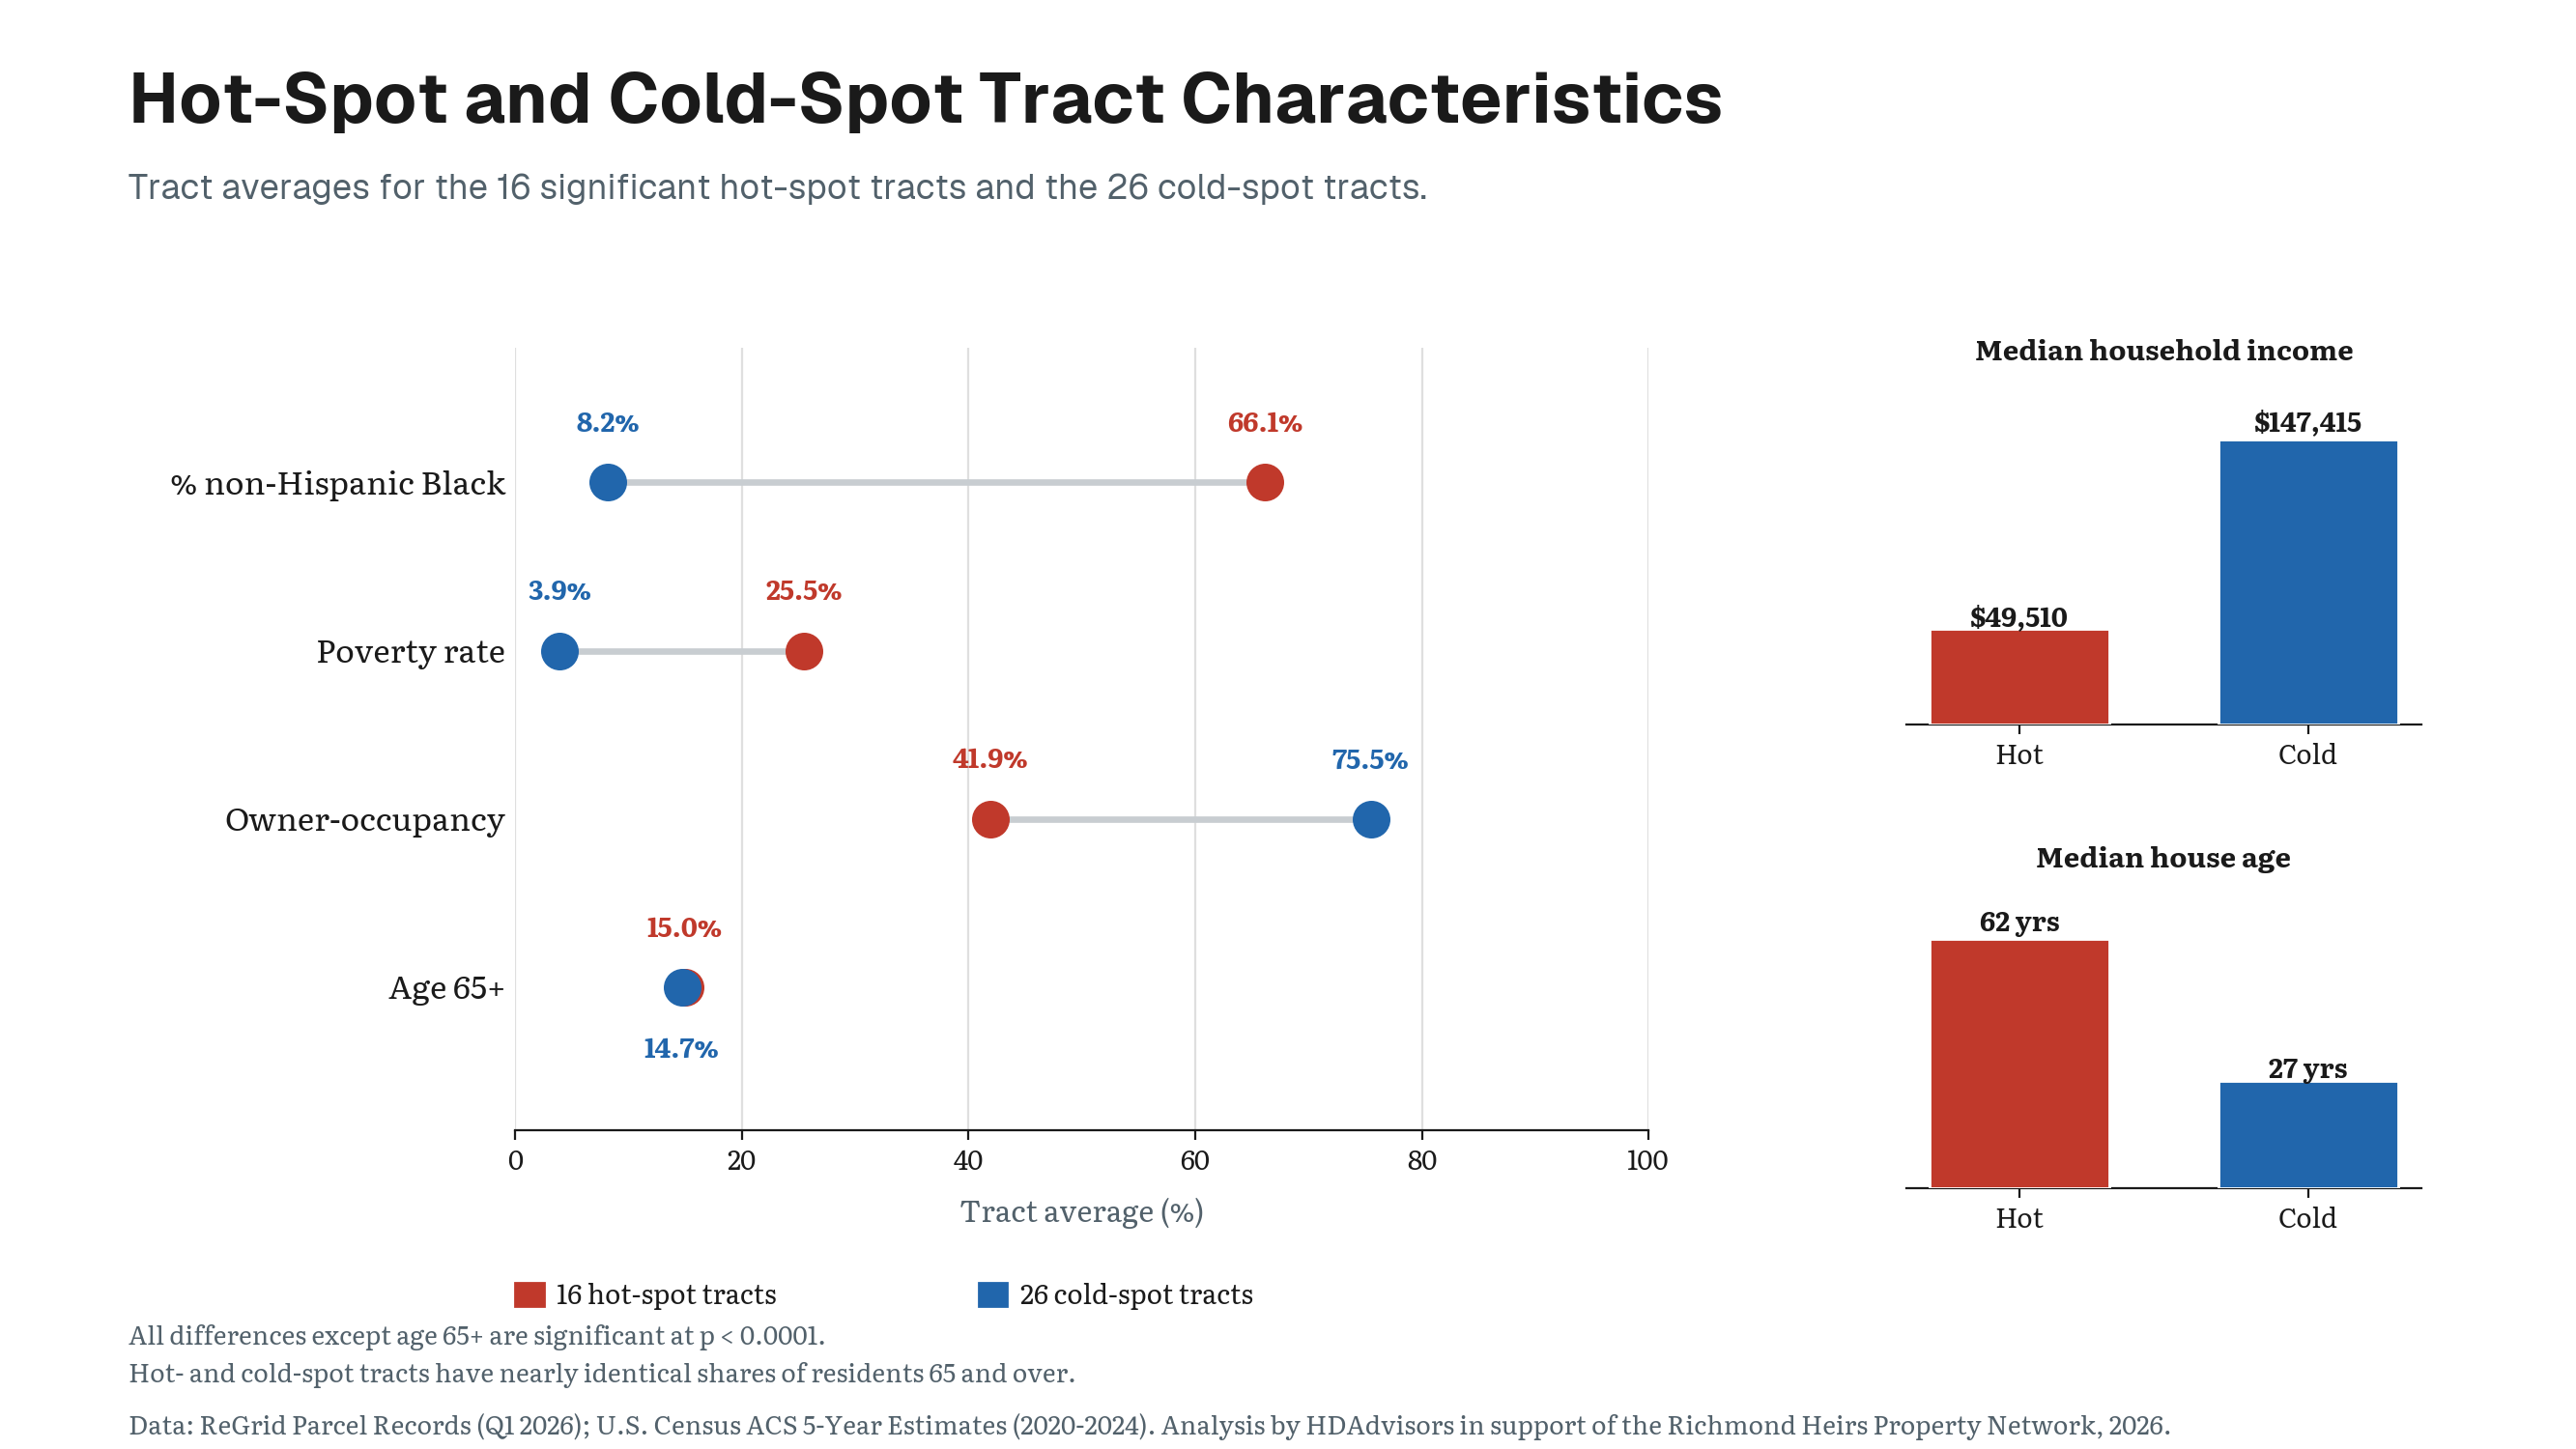
Petersburg has the highest flagged-parcel rate in the study area at 4.88%.
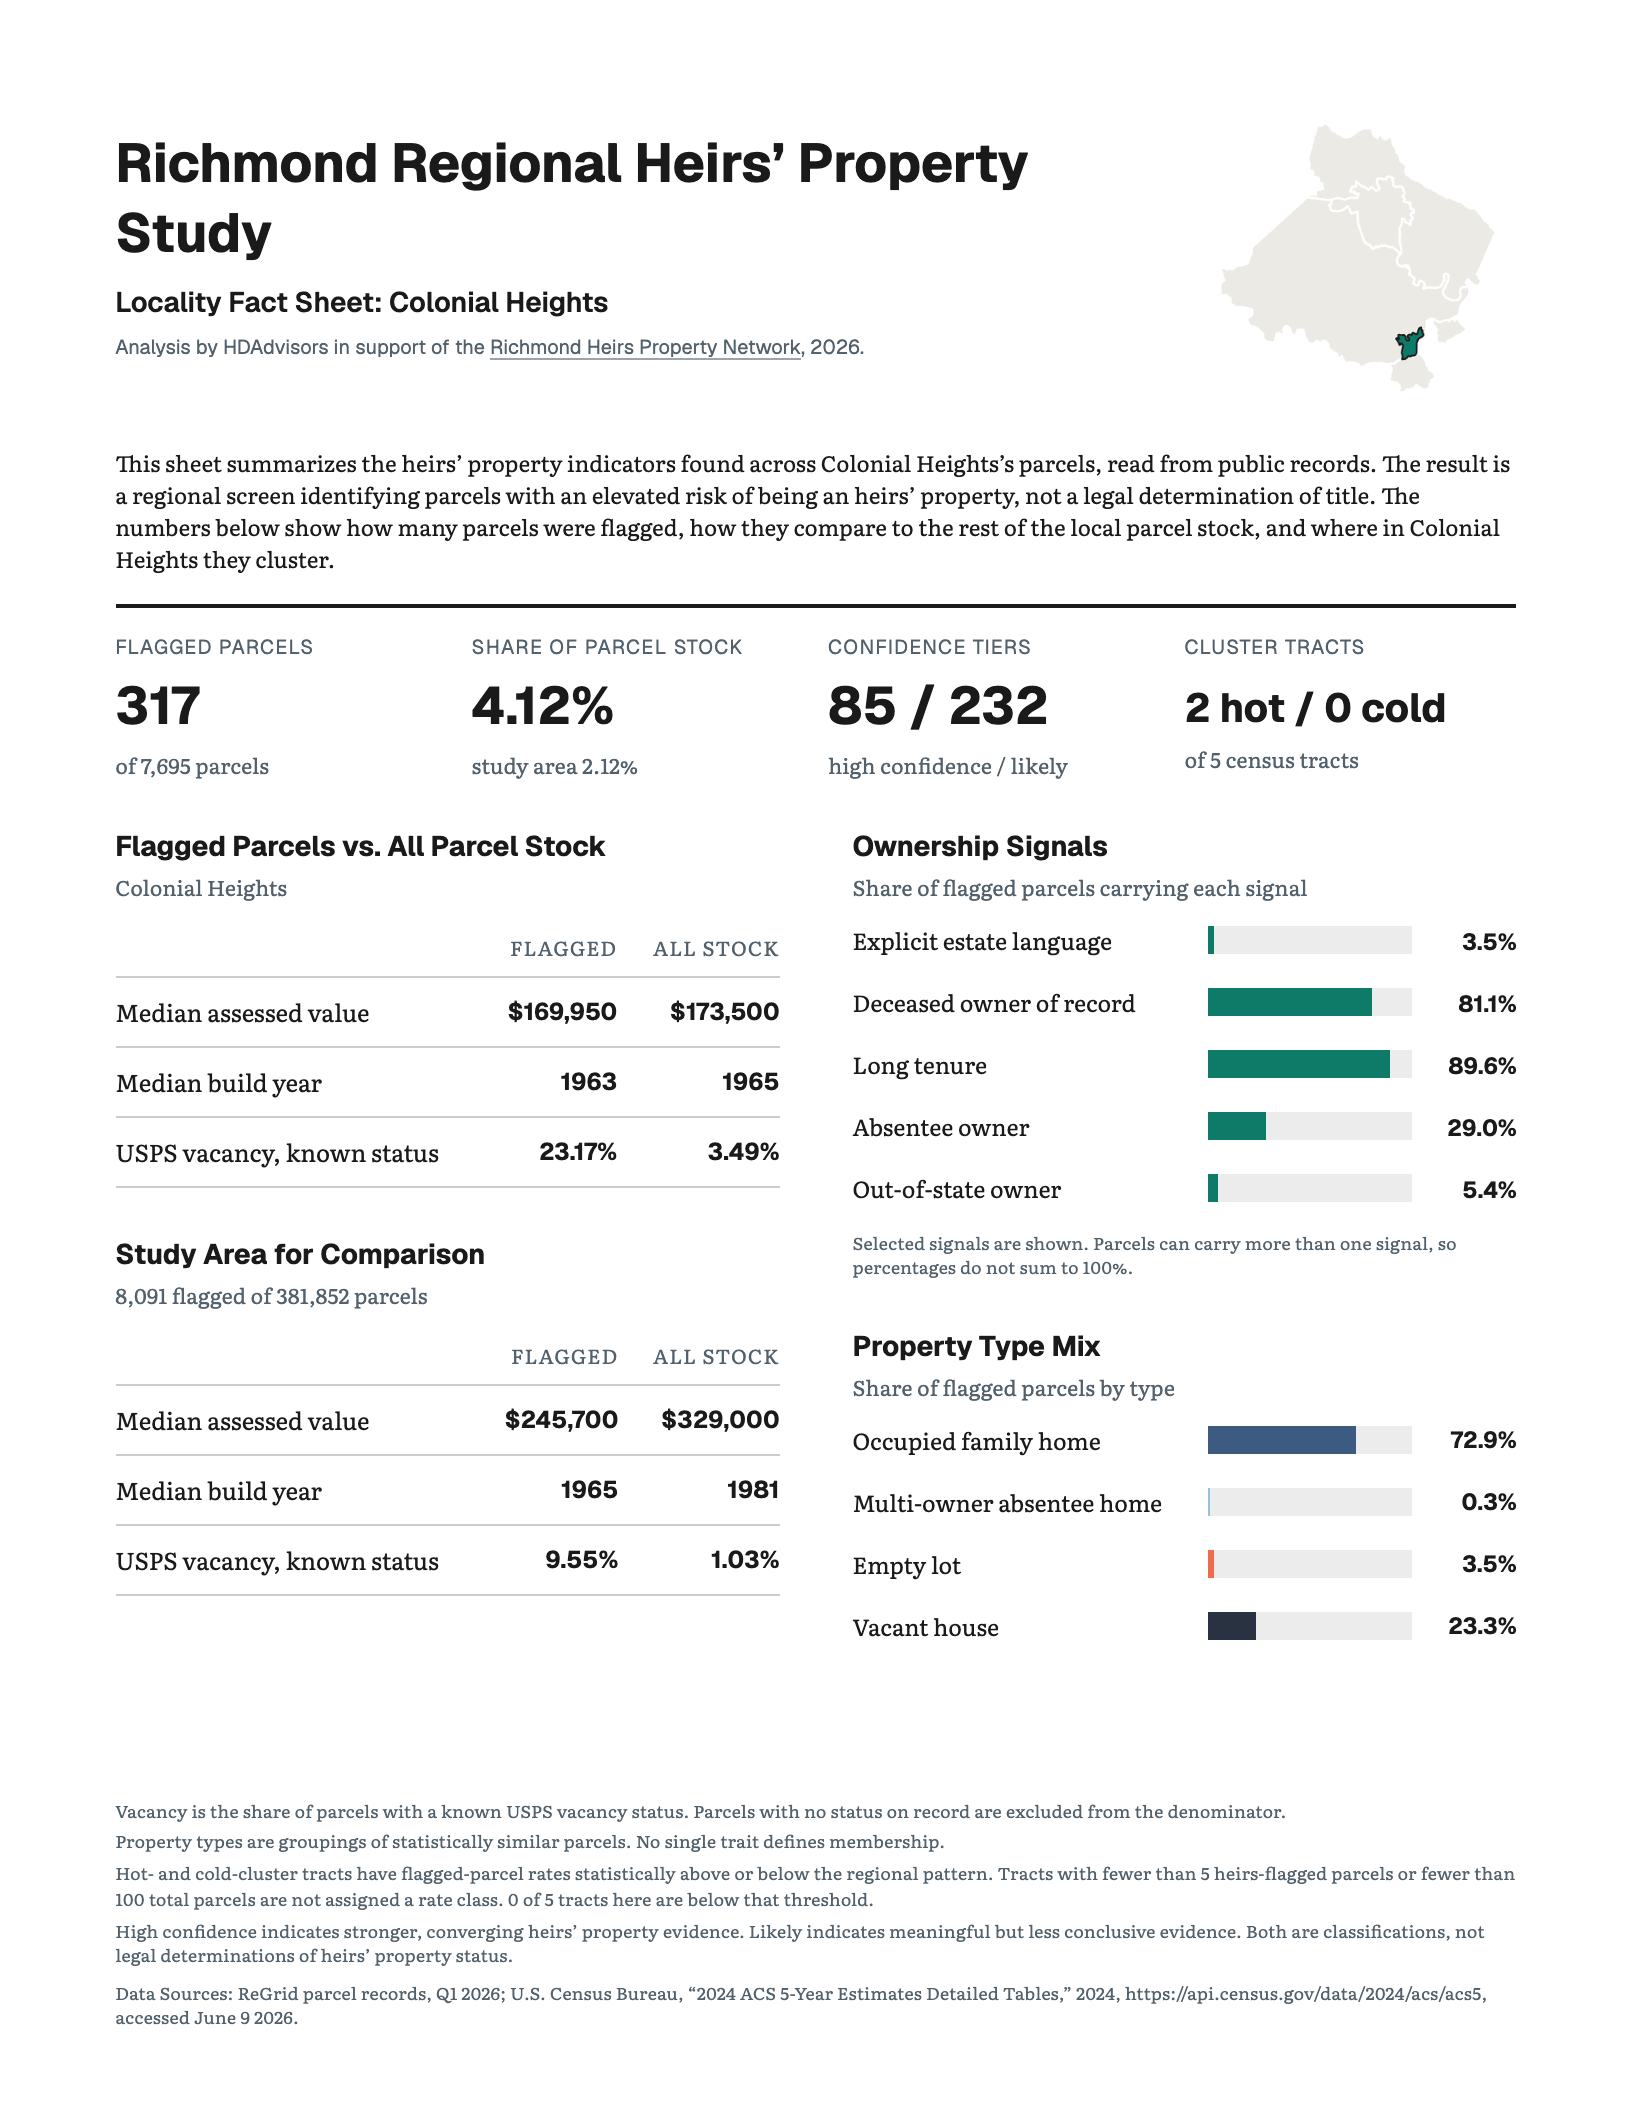
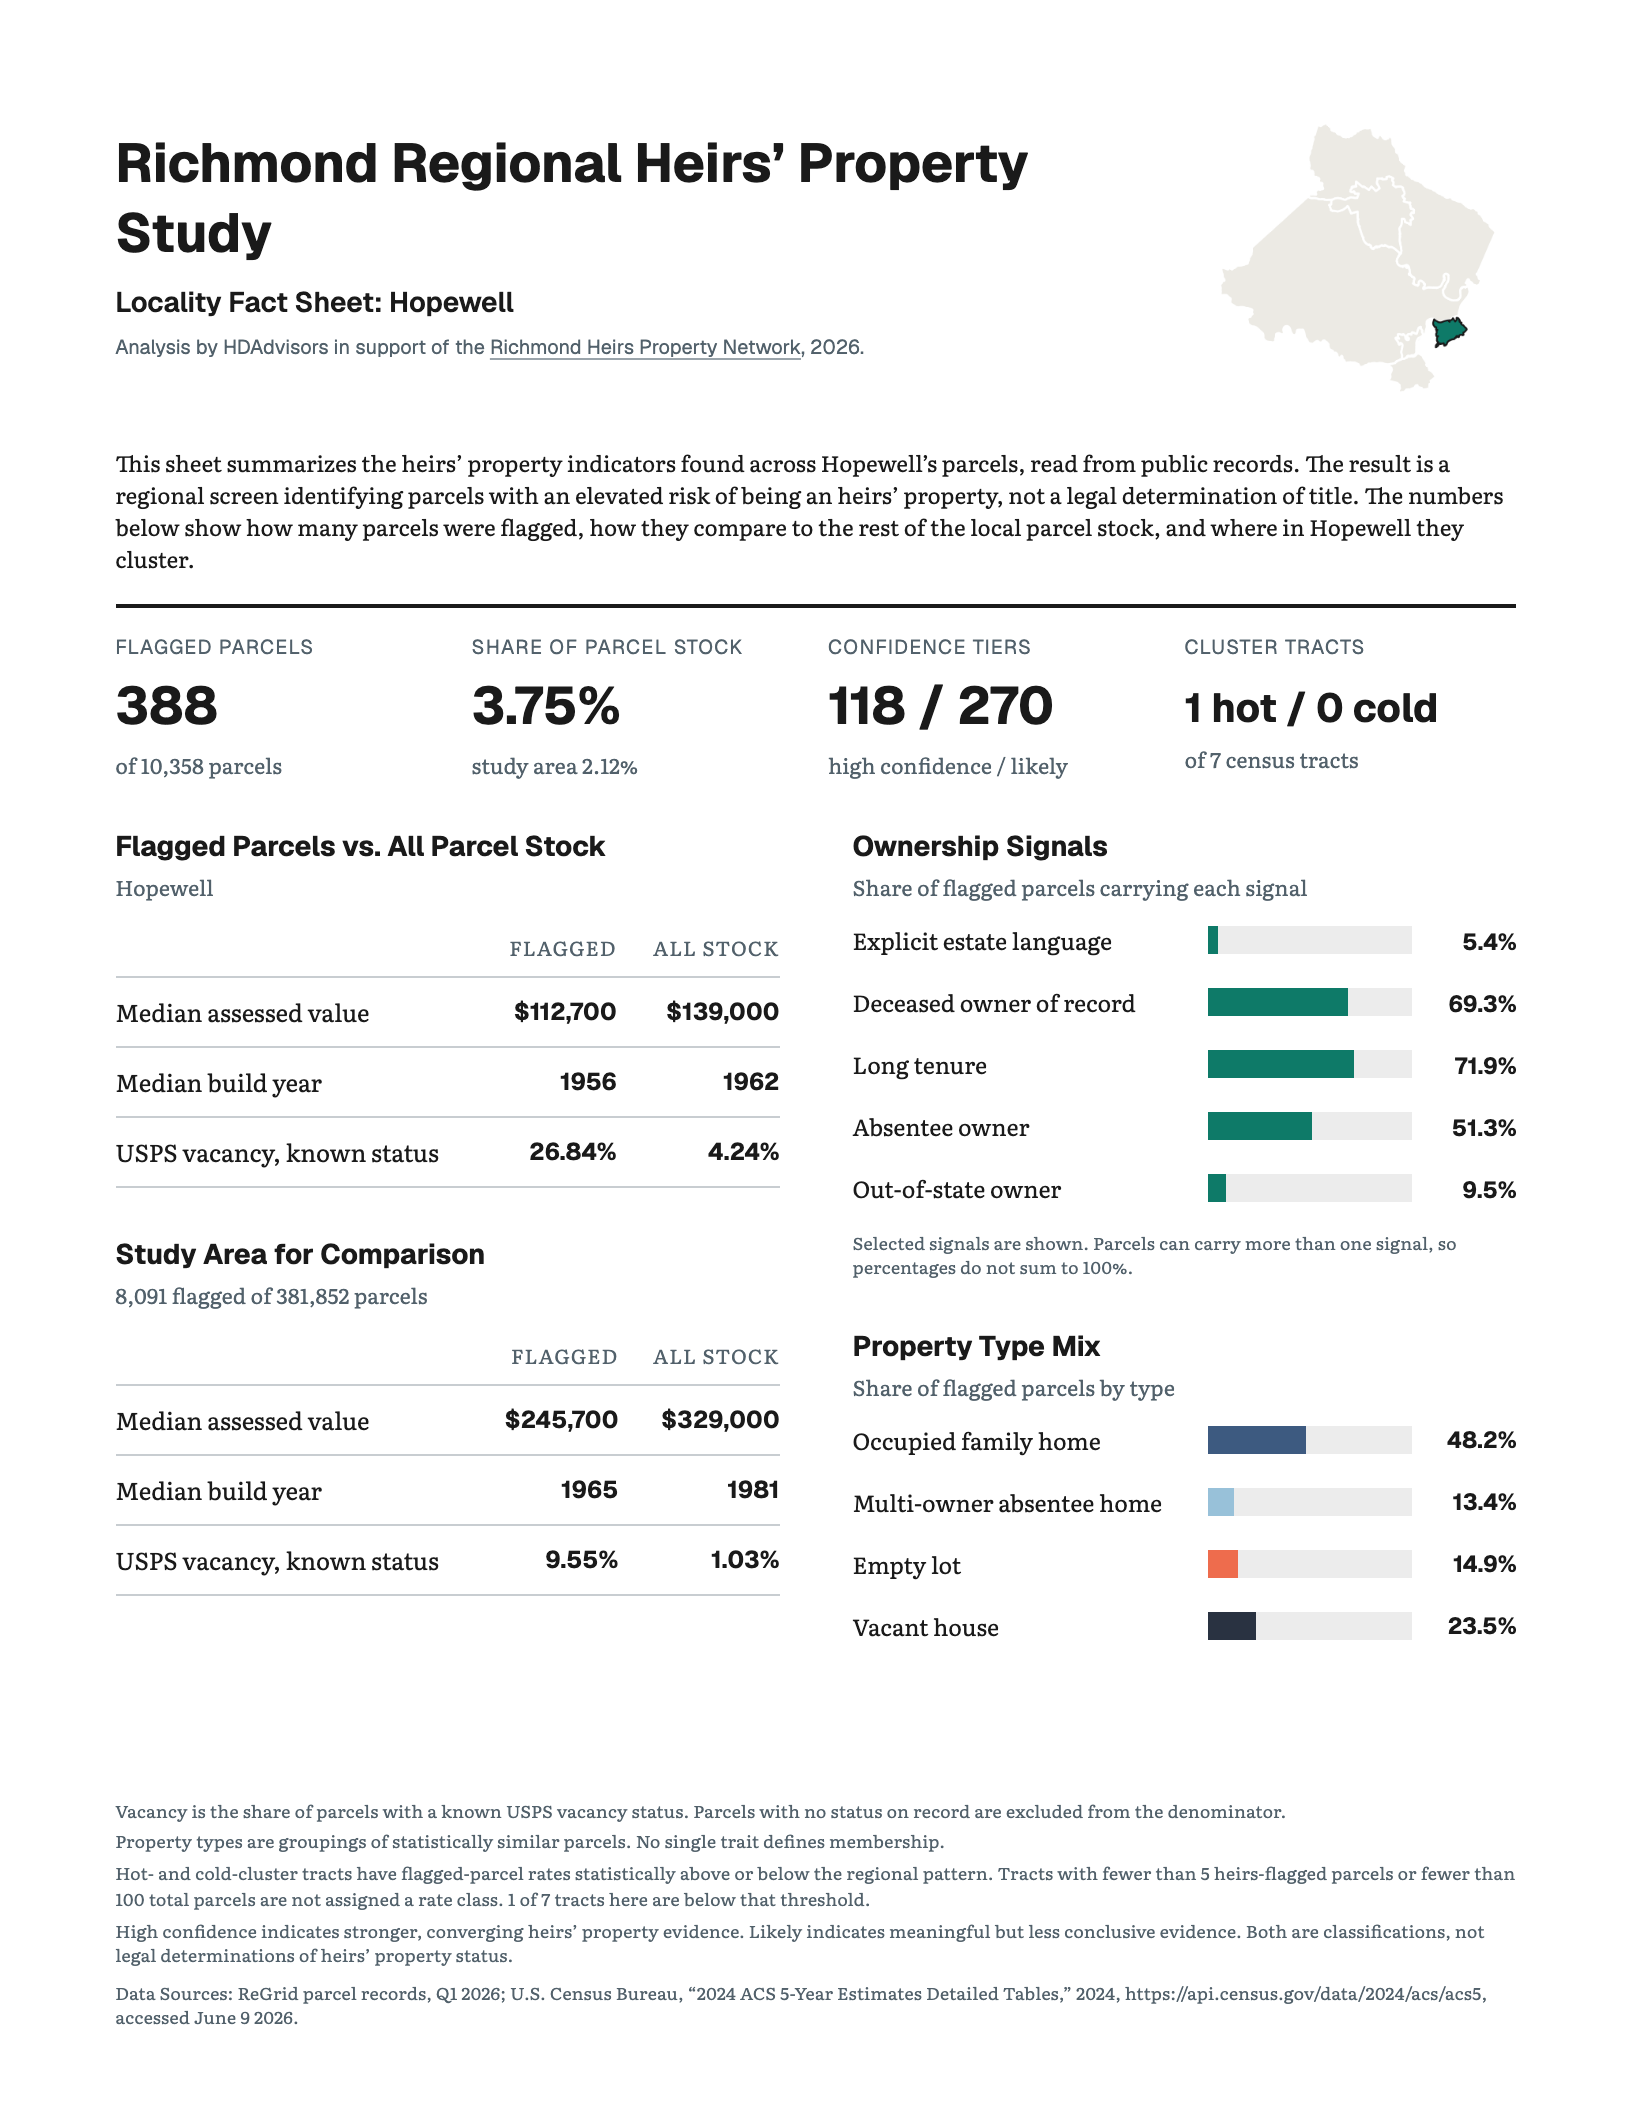
Colonial Heights follows at 4.12%, and Hopewell at 3.75%. Together, Petersburg, Colonial Heights, and Hopewell form the Tri-Cities area and have the three highest heirs’ property rates in the study.
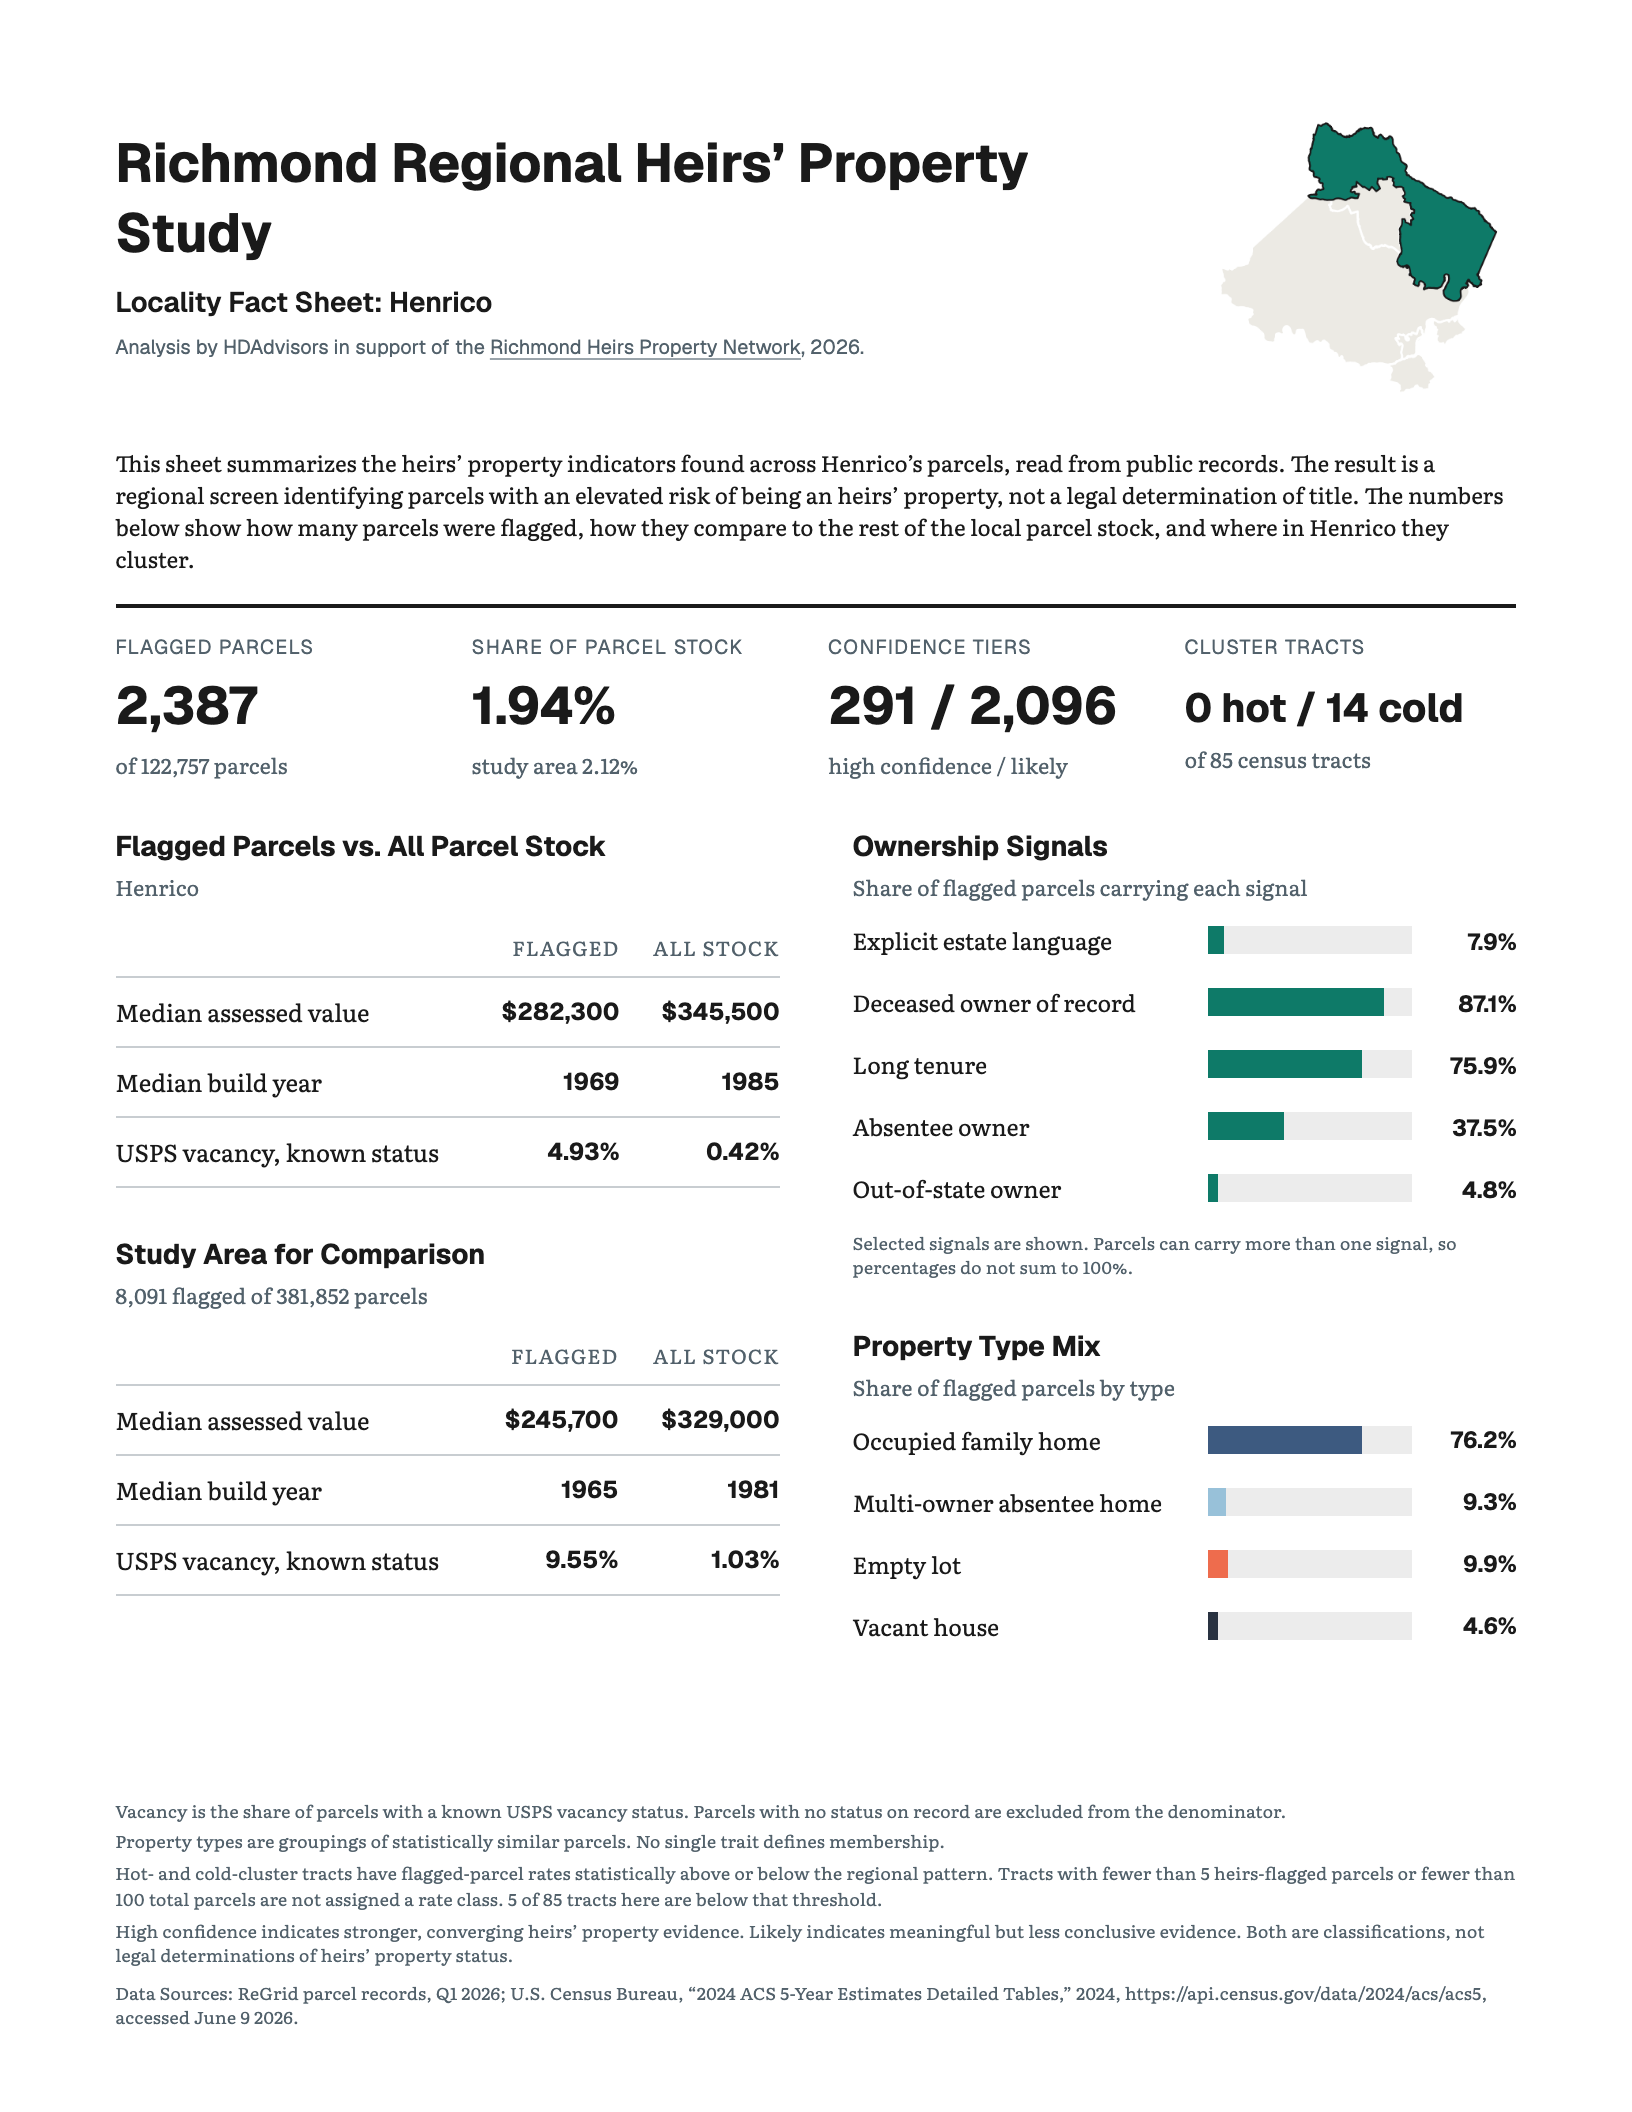
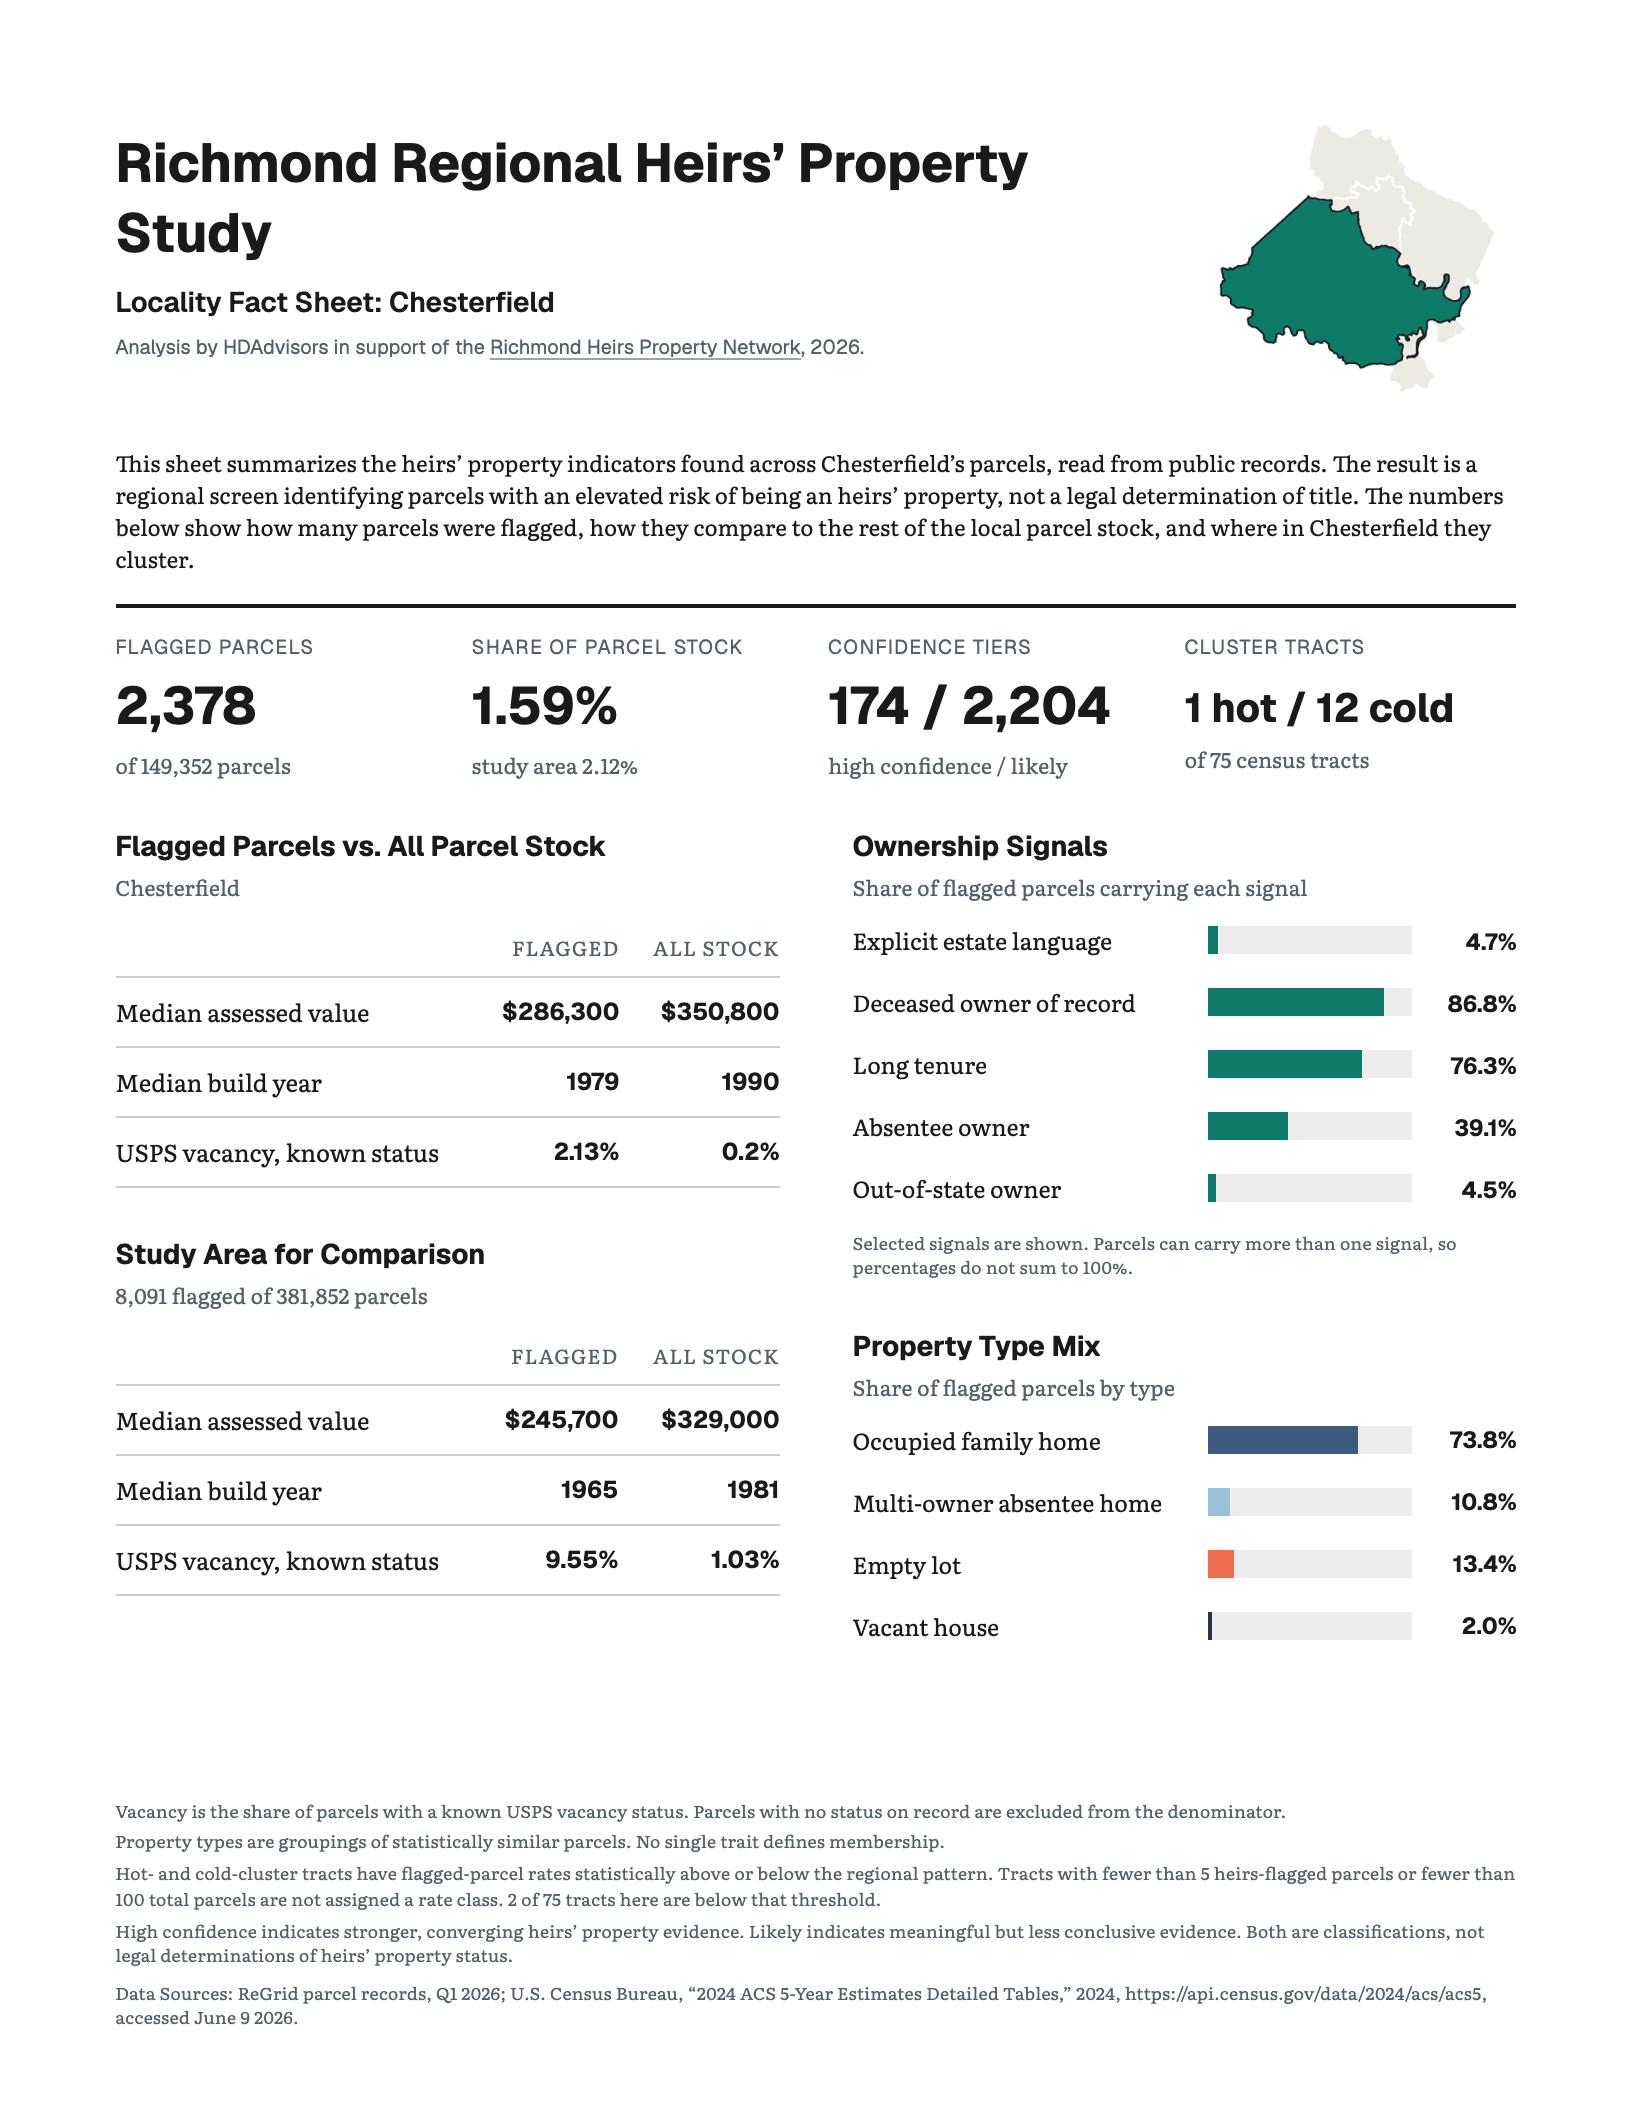
Richmond City’s rate is 2.46%, slightly above the regional average. Henrico is below the regional rate at 1.94%, and Chesterfield has the lowest locality rate in the study at 1.59%.
Takeaway
A rate and a count answer different questions.
Petersburg has the highest concentration, but larger counties can still contain more flagged parcels in total. Henrico and Chesterfield each contain more than 2,300 flagged parcels because their parcel stocks are much larger.
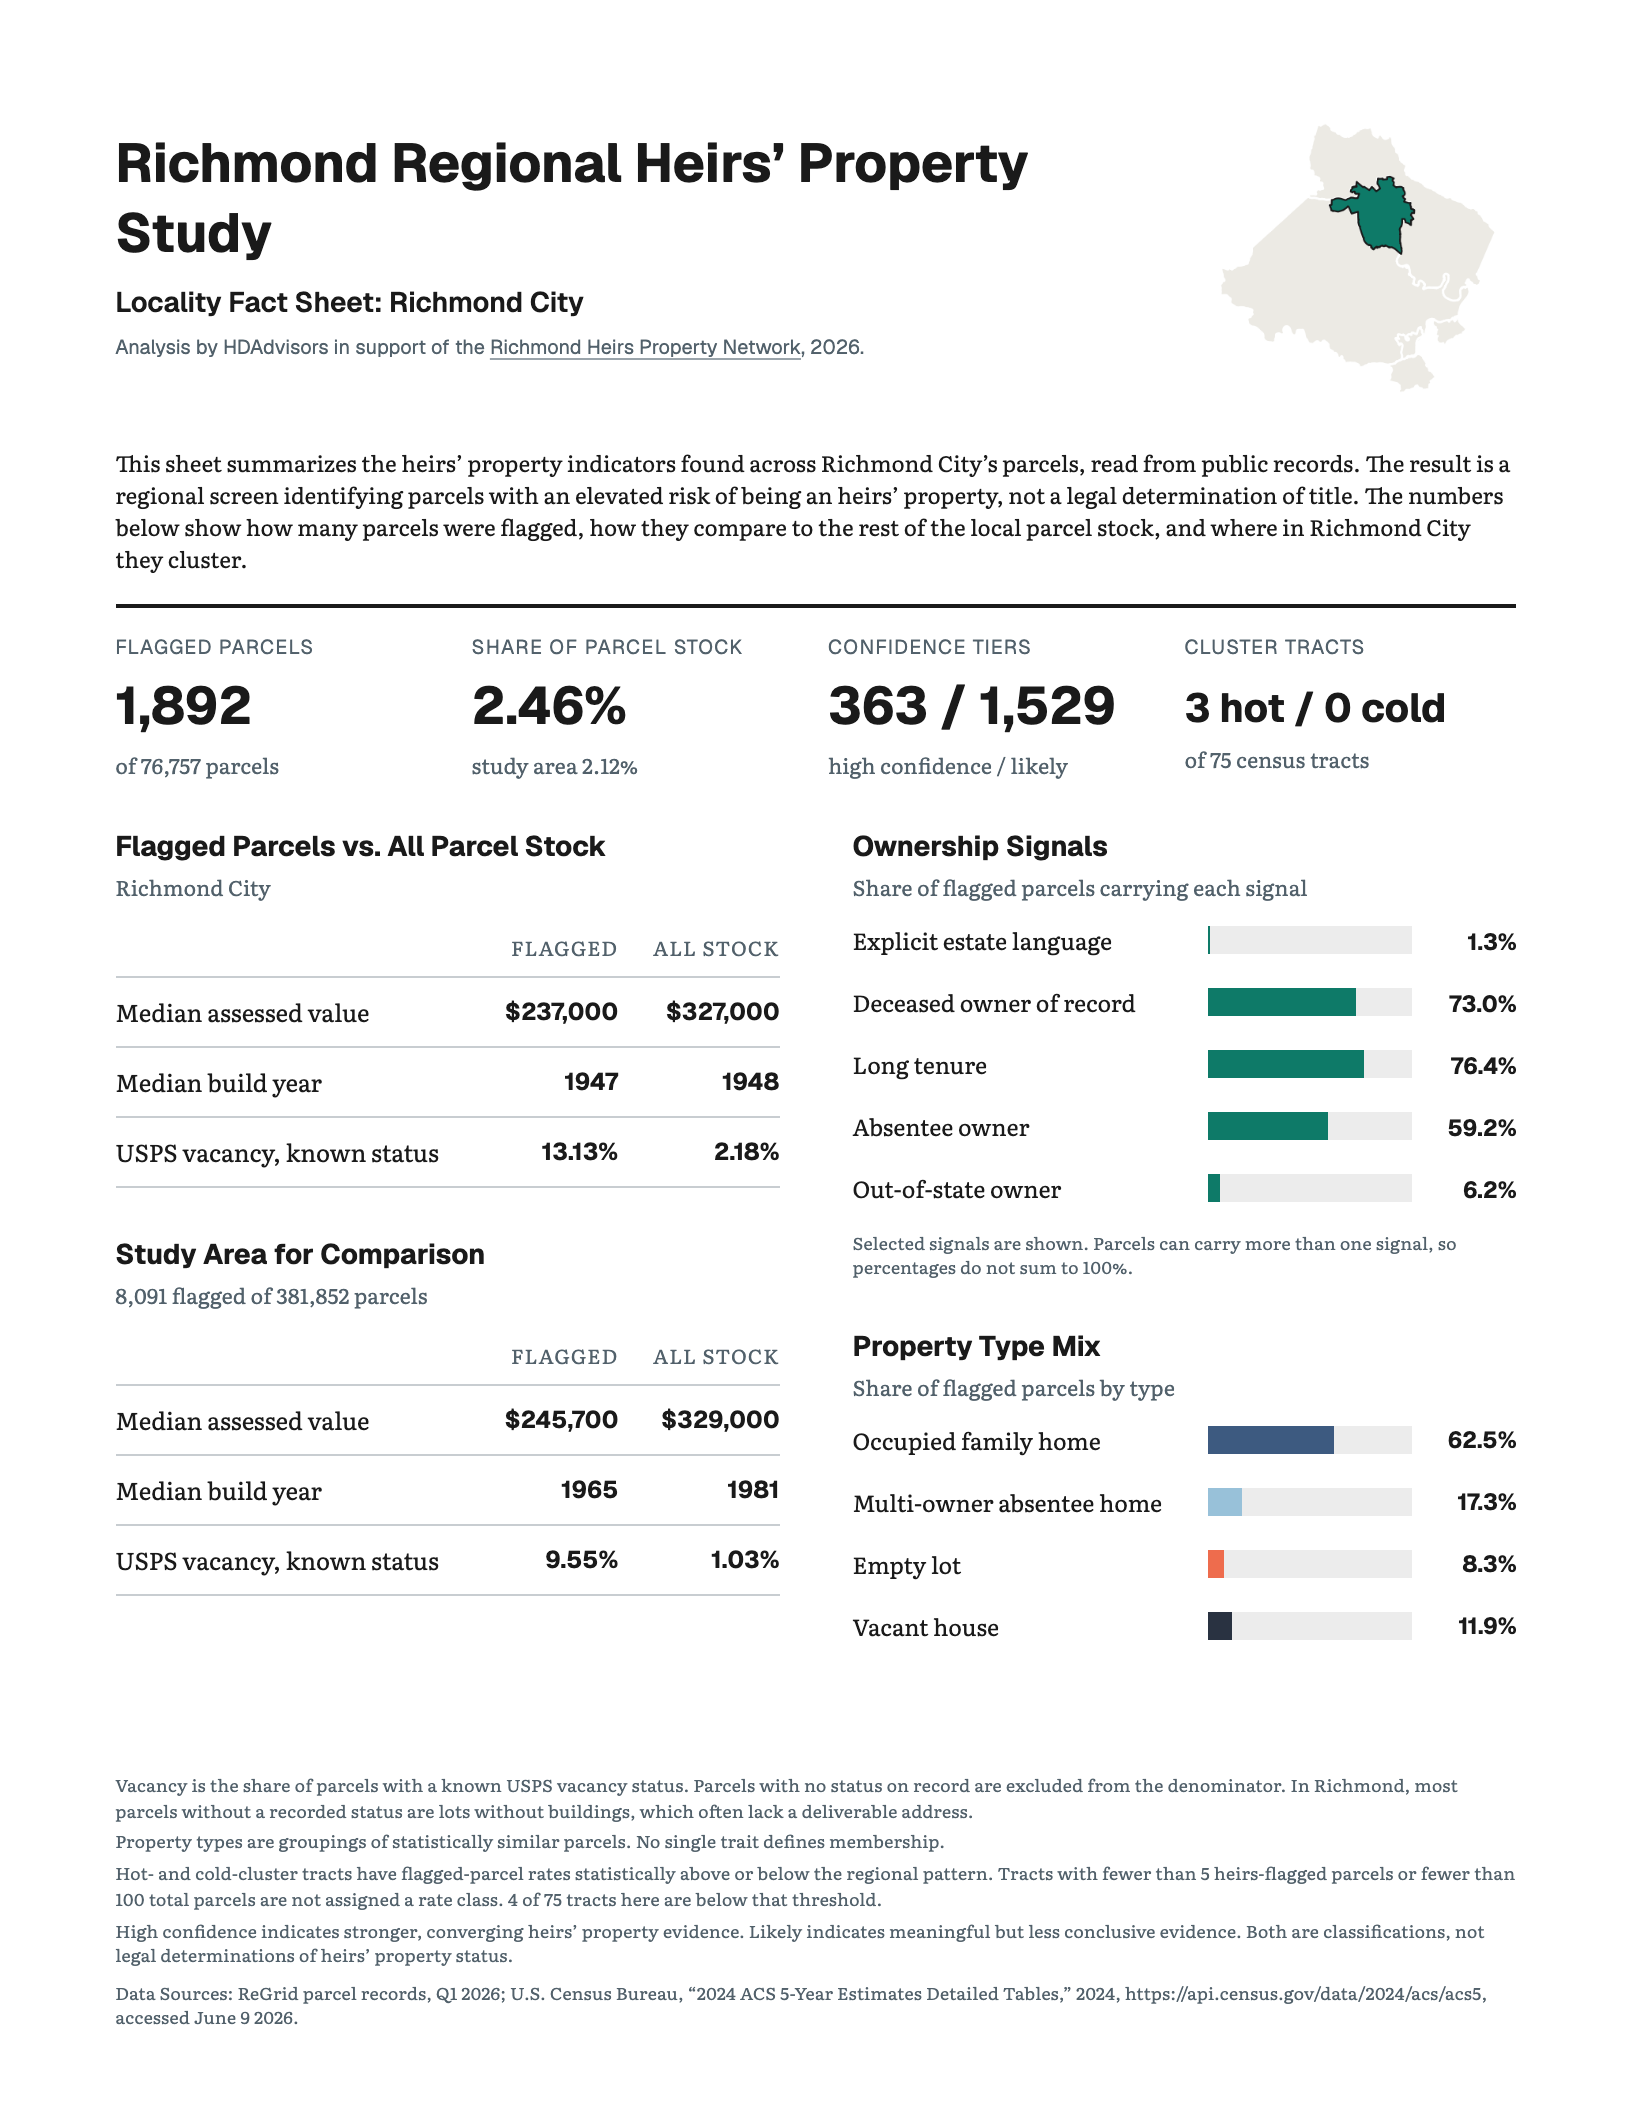
Each locality also has a fact sheet with its housing profile and ownership signals. Click a locality to open its fact sheet in the panel beside this text. Click it again to return to the chart.
Printable copies are on the Fact Sheets page.
7. Patterns Cluster by Neighborhood
Key Question
Are higher heirs’ property rates scattered randomly across the region, or do they form larger neighborhood patterns?
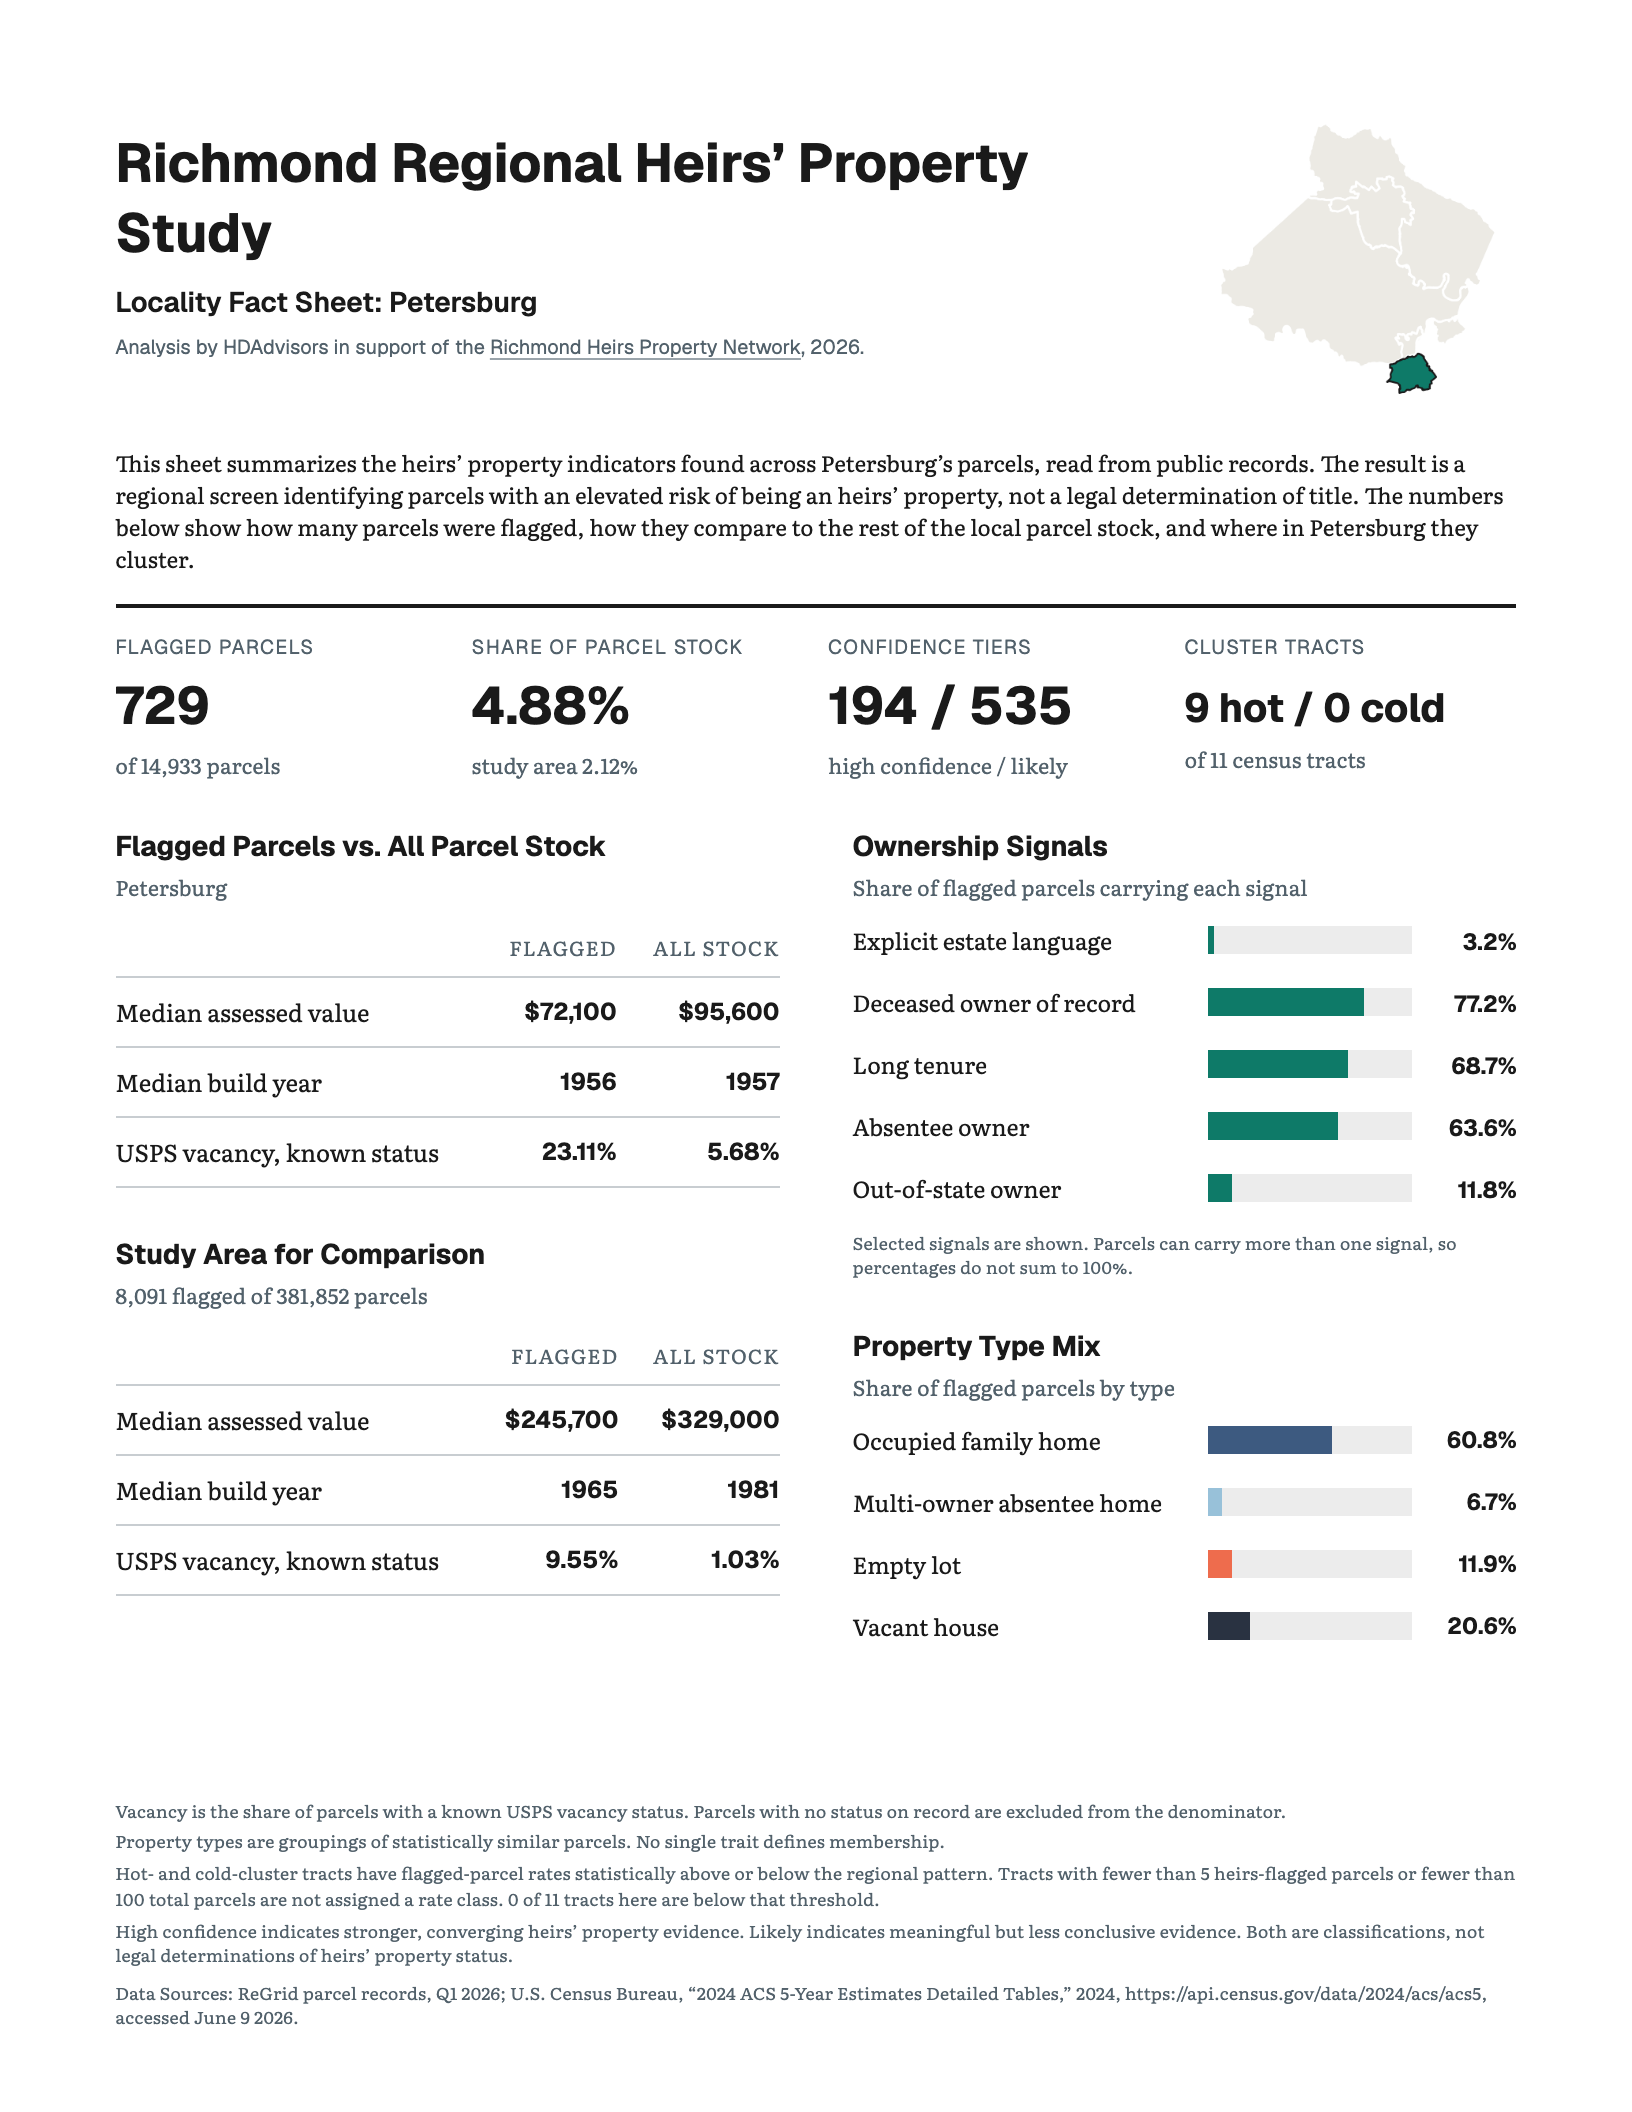
Heirs’ property risk is not randomly scattered across the region. High-rate neighborhoods tend to sit near other high-rate neighborhoods, while low-rate neighborhoods tend to sit near other low-rate neighborhoods.
How We Got There
The analysis divides the region into census tracts. A census tract is a small statistical area commonly used to describe neighborhood conditions. Tract boundaries do not always match the boundaries residents use when naming their neighborhoods, but they allow the same measures to be compared consistently across the region.
Key Finding
A core hot spot is not simply a tract with a high rate. It is a tract with a high rate that is also surrounded by elevated rates, with the pattern confirmed by six separate spatial tests. Cold spots are the reverse, tracts with unusually low rates surrounded by other low-rate areas.
Takeaway
These clusters have a clear regional geography. Most hot spots form a connected concentration through Petersburg, Colonial Heights, and Hopewell, with a smaller group in eastern Richmond. Cold spots are concentrated in western Chesterfield and northwestern Henrico.
8. Clustering Across Tracts
Key Question
Do flagged properties cluster together within neighborhoods, even when those clusters cross census tract boundaries?
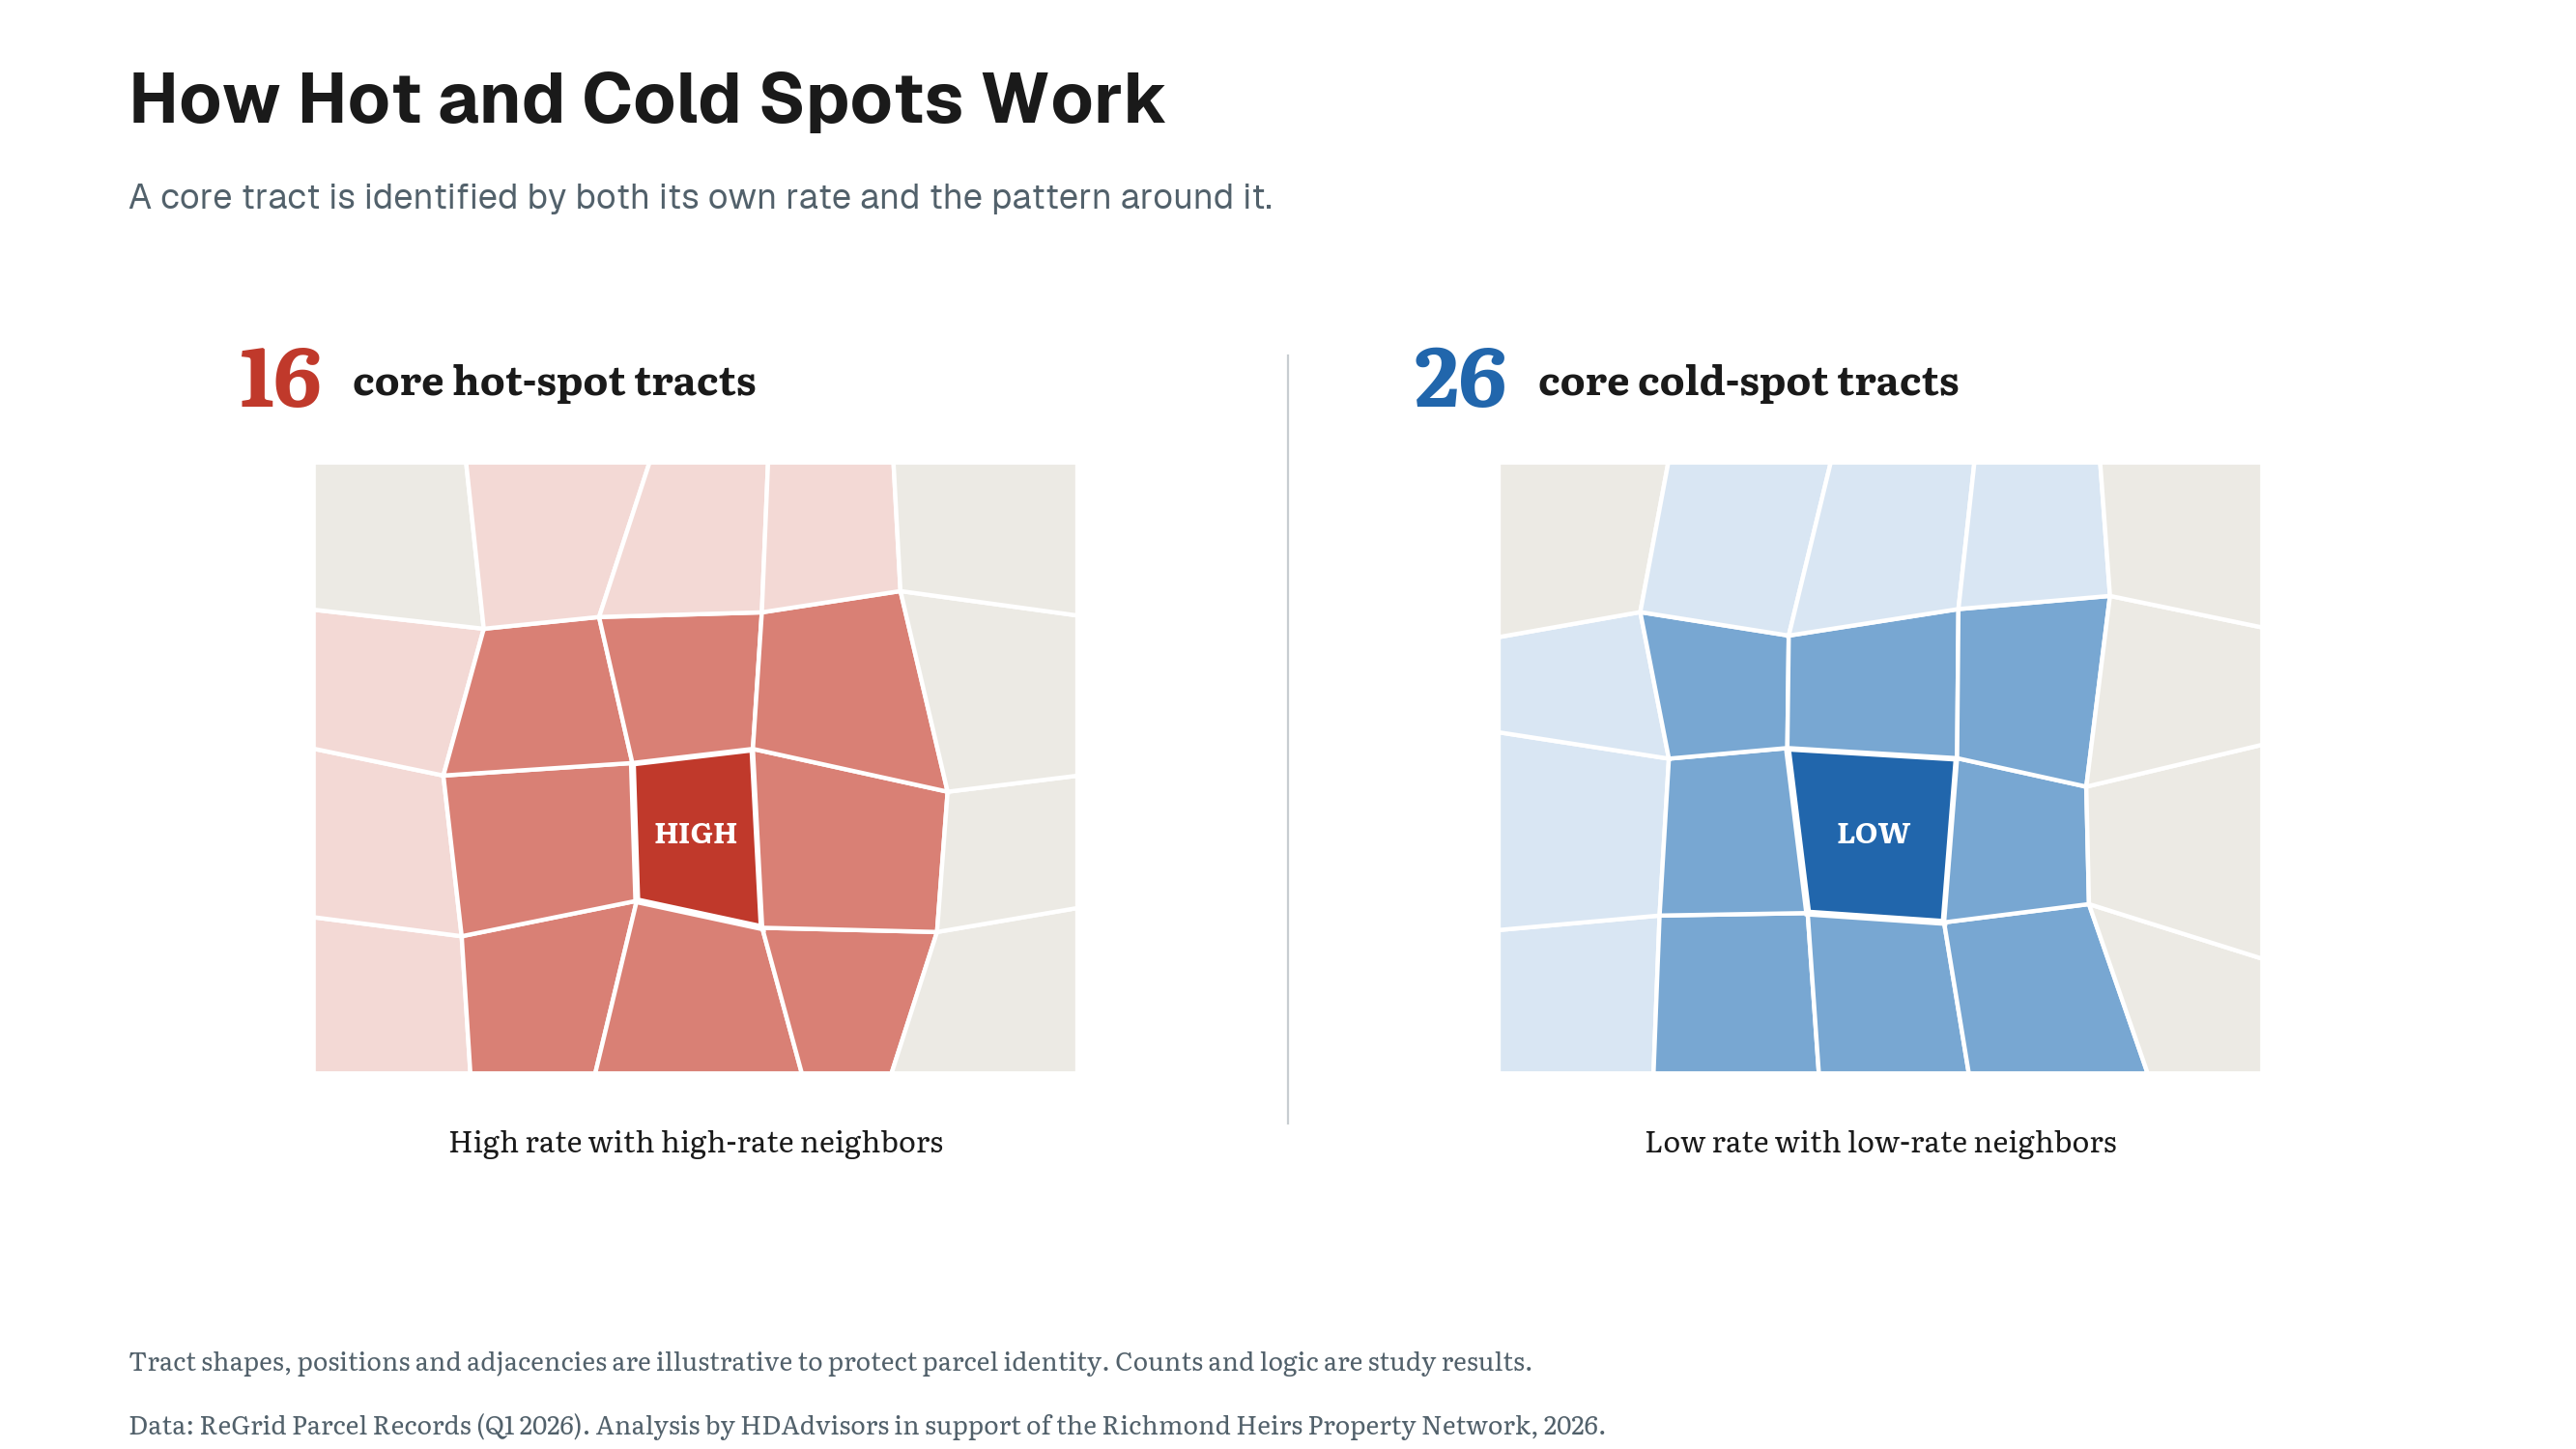
Heirs’ properties are not scattered randomly across the region. They tend to appear near one another, often forming neighborhood- and block-level concentrations that continue across census tract boundaries.
How We Got There
We measured this pattern using a spatial test called Ripley’s K. This test counts how many flagged parcels are located near other flagged parcels, then compares that result with 999 random arrangements of the same number of parcels across the region’s actual parcel stock. If location did not matter, the observed pattern and random pattern would look much the same.6
This chart shows the clustering pattern at 250 meters, including concentrations that continue across census tract boundaries.
Key Finding
At a distance of 250 meters, heirs’ properties were 61% more clustered than expected from a random pattern.
The pattern held at every distance tested, from 250 meters to 5 kilometers, meaning flagged parcels stayed more clustered than a random arrangement no matter how wide an area the test considered.
Takeaway
Heirs’ property is not only more common in some cities or census tracts than others. It is also concentrated within neighborhoods, and those concentrations do not stop at administrative lines. In practical terms, this means outreach should not be contained to one or two census tracts, but should extend into multiple clustered neighborhoods.
9. Hot and Cold Spots
The neighborhoods at the two ends of the pattern differ sharply.
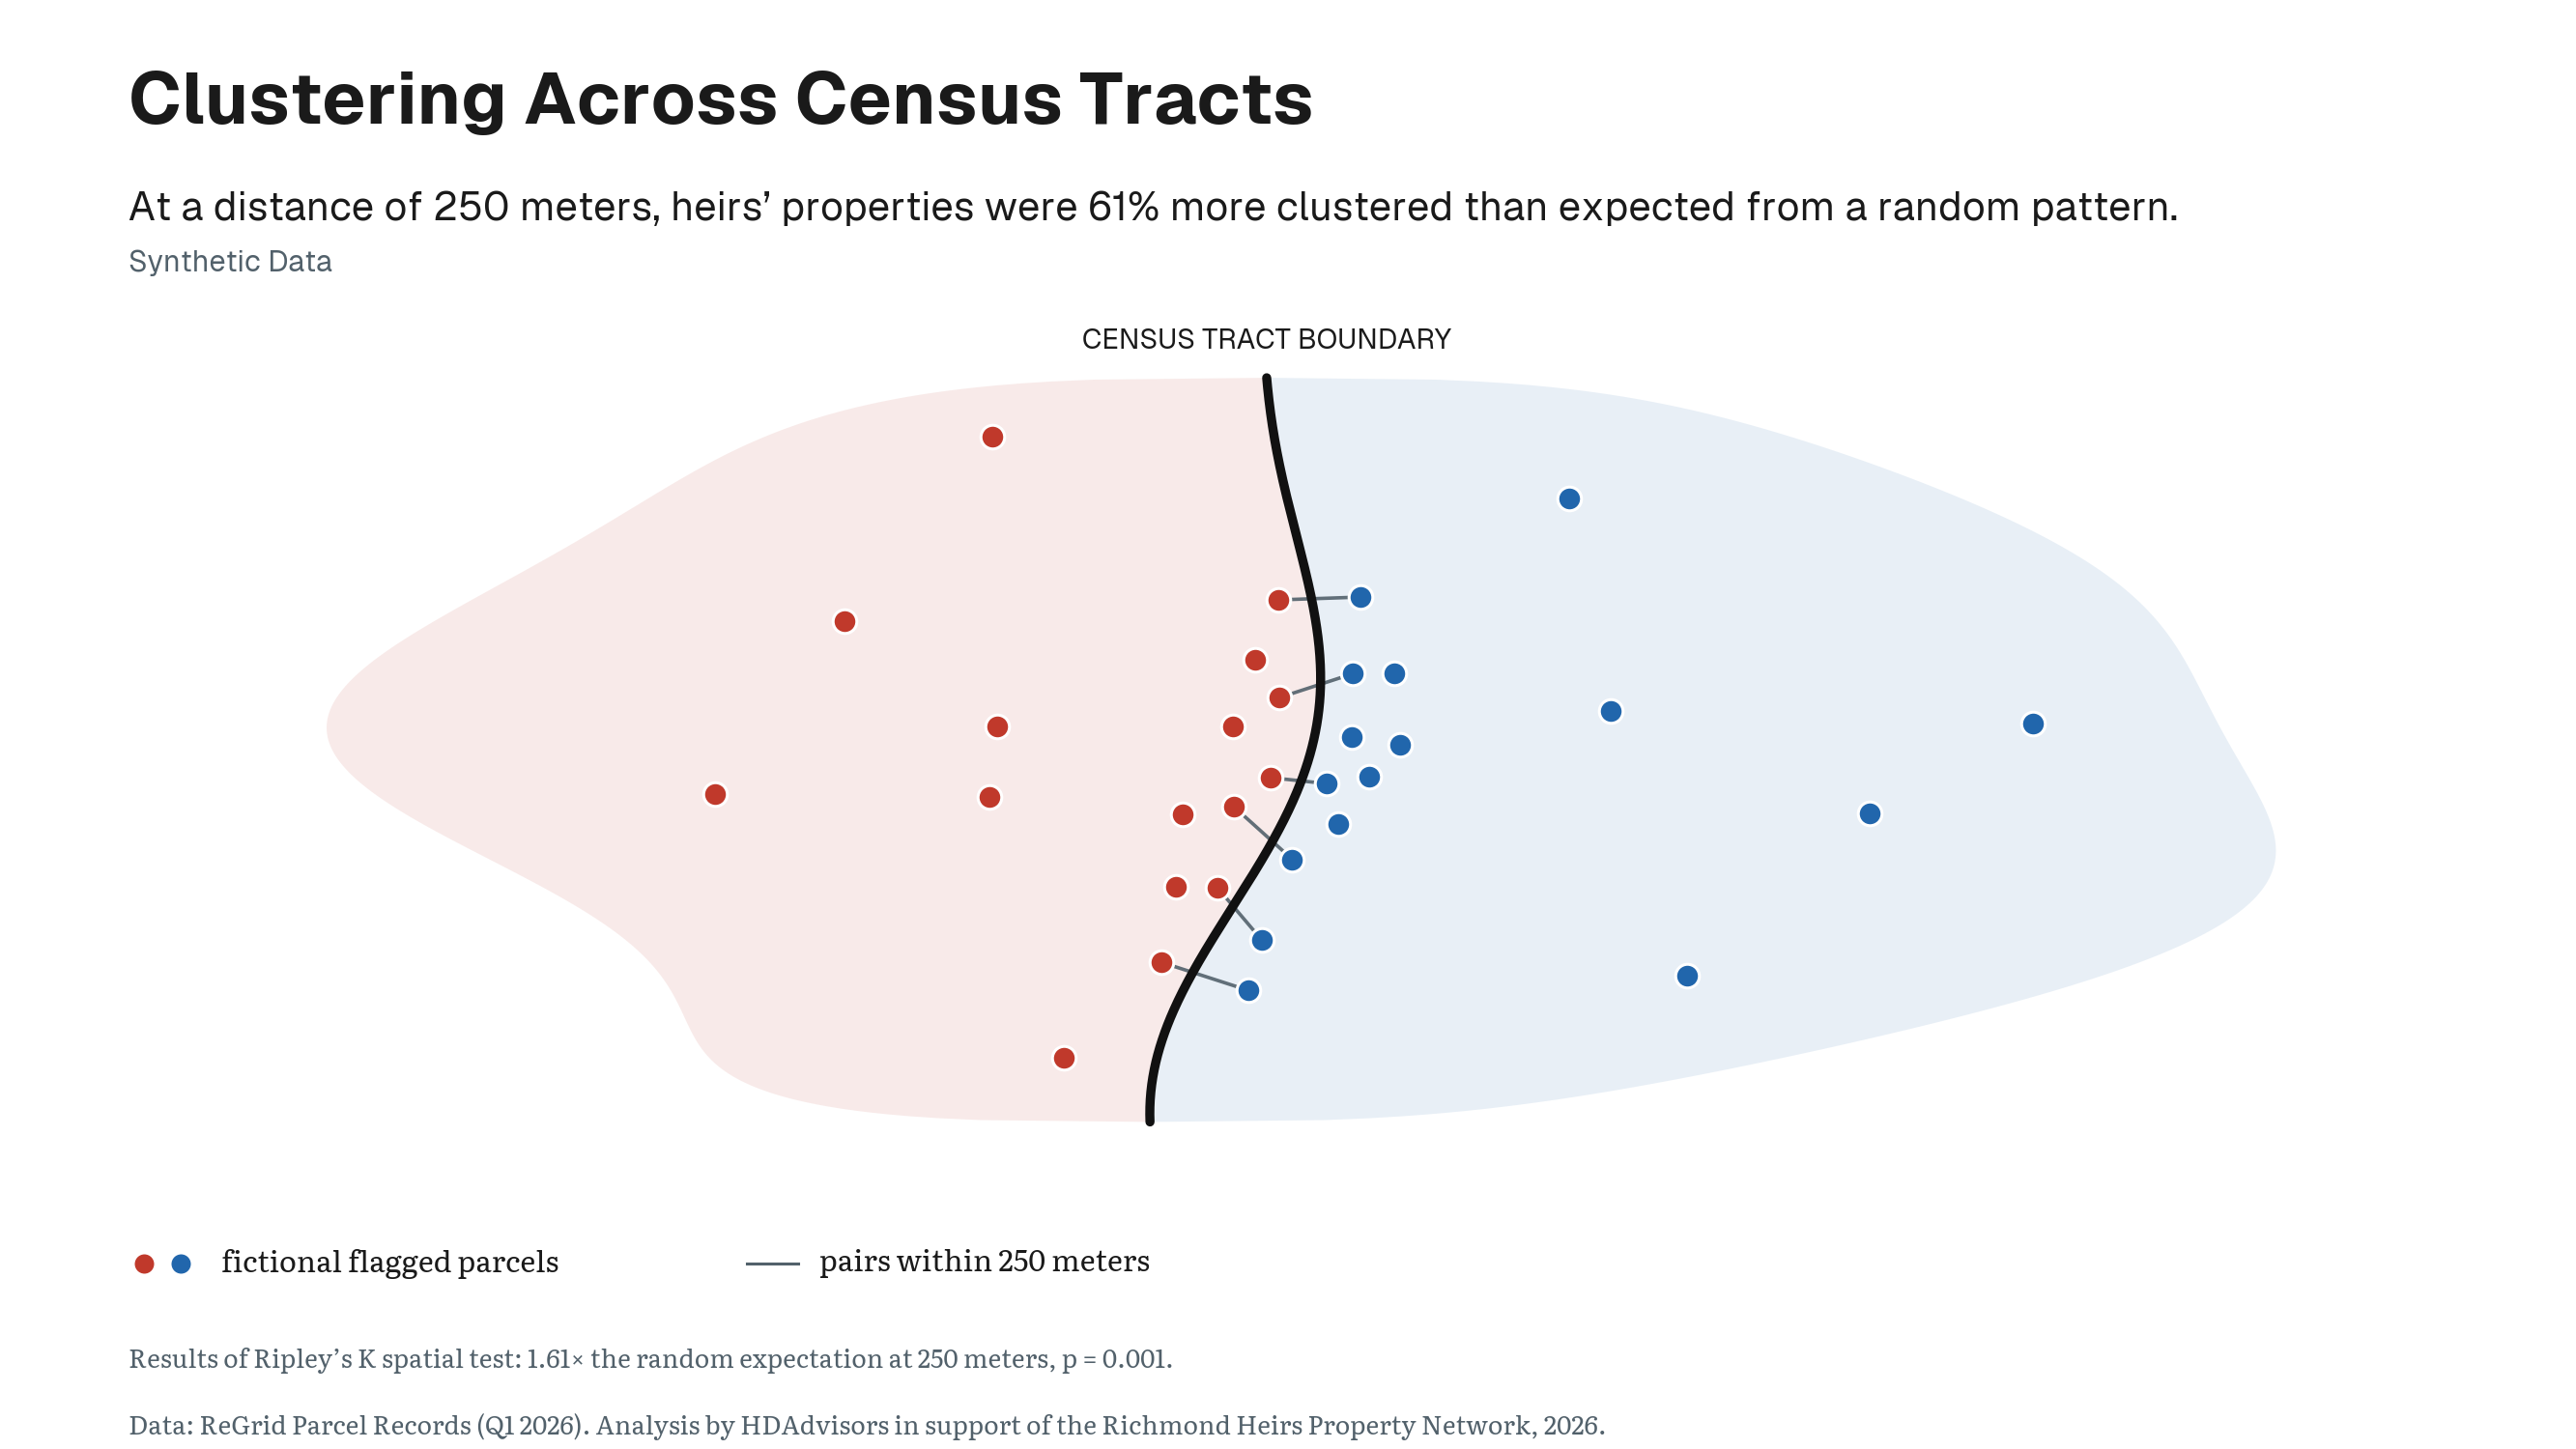
Residents of the 16 core hot-spot tracts are, on average, 66.1% non-Hispanic Black, compared with 8.2% in the 26 core cold-spot tracts.
The average poverty rate is 25.5% in hot spots and 3.9% in cold spots. Median household income is approximately $49,510 in hot spots, compared with $147,415 in cold spots. The housing stock is substantially older, and owner occupancy is lower, in hot spots: a median house age of 62 years against 27 in cold spots, and owner-occupancy of 41.9% against 75.5%.
One comparison is uniquely insightful. The share of residents age 65 or older is virtually identical between cold and hot spots, 15.0% in the latter and 14.7% in the former. The geographic pattern therefore cannot be explained simply by saying that hot spot neighborhoods contain more older residents.
Importantly, these figures describe neighborhoods, not individual owners. They do not establish the race, income, or circumstances of any particular family living in a flagged property. They only show that heirs’ properties concentrate within a broader geography of racial and economic inequality.
10. Poverty Plays a Role
Key Question
Is the geography of heirs’ property primarily a reflection of economic disadvantage?
Poverty is strongly associated with heirs’ property. Neighborhoods with higher poverty, lower incomes, and lower owner-occupancy generally have higher flagged-parcel rates.7
But poverty does not account for the full racial patterns in this region.
The map beside this text lets you compare the same geography by poverty, Black population share, and heirs’ property rate.
How We Got There
The analysis compared tracts while accounting for poverty, housing age, owner-occupancy, and the share of residents age 65 or older.
Key Finding
Among otherwise similar tracts, a 10-percentage-point increase in the non-Hispanic Black population share was associated with 11.3% more flagged properties.
In other words, for every 10-percentage-point increase in a neighborhood’s Black population share, the number of flagged heirs’ properties was 11.3% higher, even after accounting for poverty, housing age, owner-occupancy, and the share of older residents.
Additional tests accounted for the fact that neighboring tracts often resemble one another. The association remained positive after that geographic similarity was considered.8
Relationship to Poverty
Poverty explains some, but not all, of this relationship. The analysis estimates that about 38% of the relationship between Black population share and heirs’ property is associated with poverty and related economic conditions.
That leaves a substantial share of the relationship unexplained by those factors. In fact, the relationship between race and heirs’ property was stronger in lower-poverty neighborhoods, not weaker.
Takeaway
These findings show association rather than individual causation. They do not mean that the racial composition of a neighborhood causes a particular title problem. They show that unresolved title has developed within a regional housing system whose opportunities and risks have long been distributed unequally.
11. Today’s Heirs’ Properties Follow Historical Exclusion
Key Question
Do today’s heirs’ property patterns line up with the geography of historical housing exclusion?
Heirs’ properties do not appear in a vacuum.
In the 1930s, the federal Home Owners’ Loan Corporation, or HOLC, evaluated neighborhoods for mortgage-lending risk. Richmond neighborhoods received grades from A, considered the safest places for lenders, through D, labeled “hazardous.”
Black residents and other marginalized groups were routinely treated as lending risks. Neighborhoods where they lived were often assigned the lowest grade and outlined in red, or redlined. These maps helped institutionalize unequal access to mortgages, home improvement credit, and the wealth-building benefits of homeownership. The legacy of these practices is reflected in the landscape of heirs’ properties today.9
Key Finding
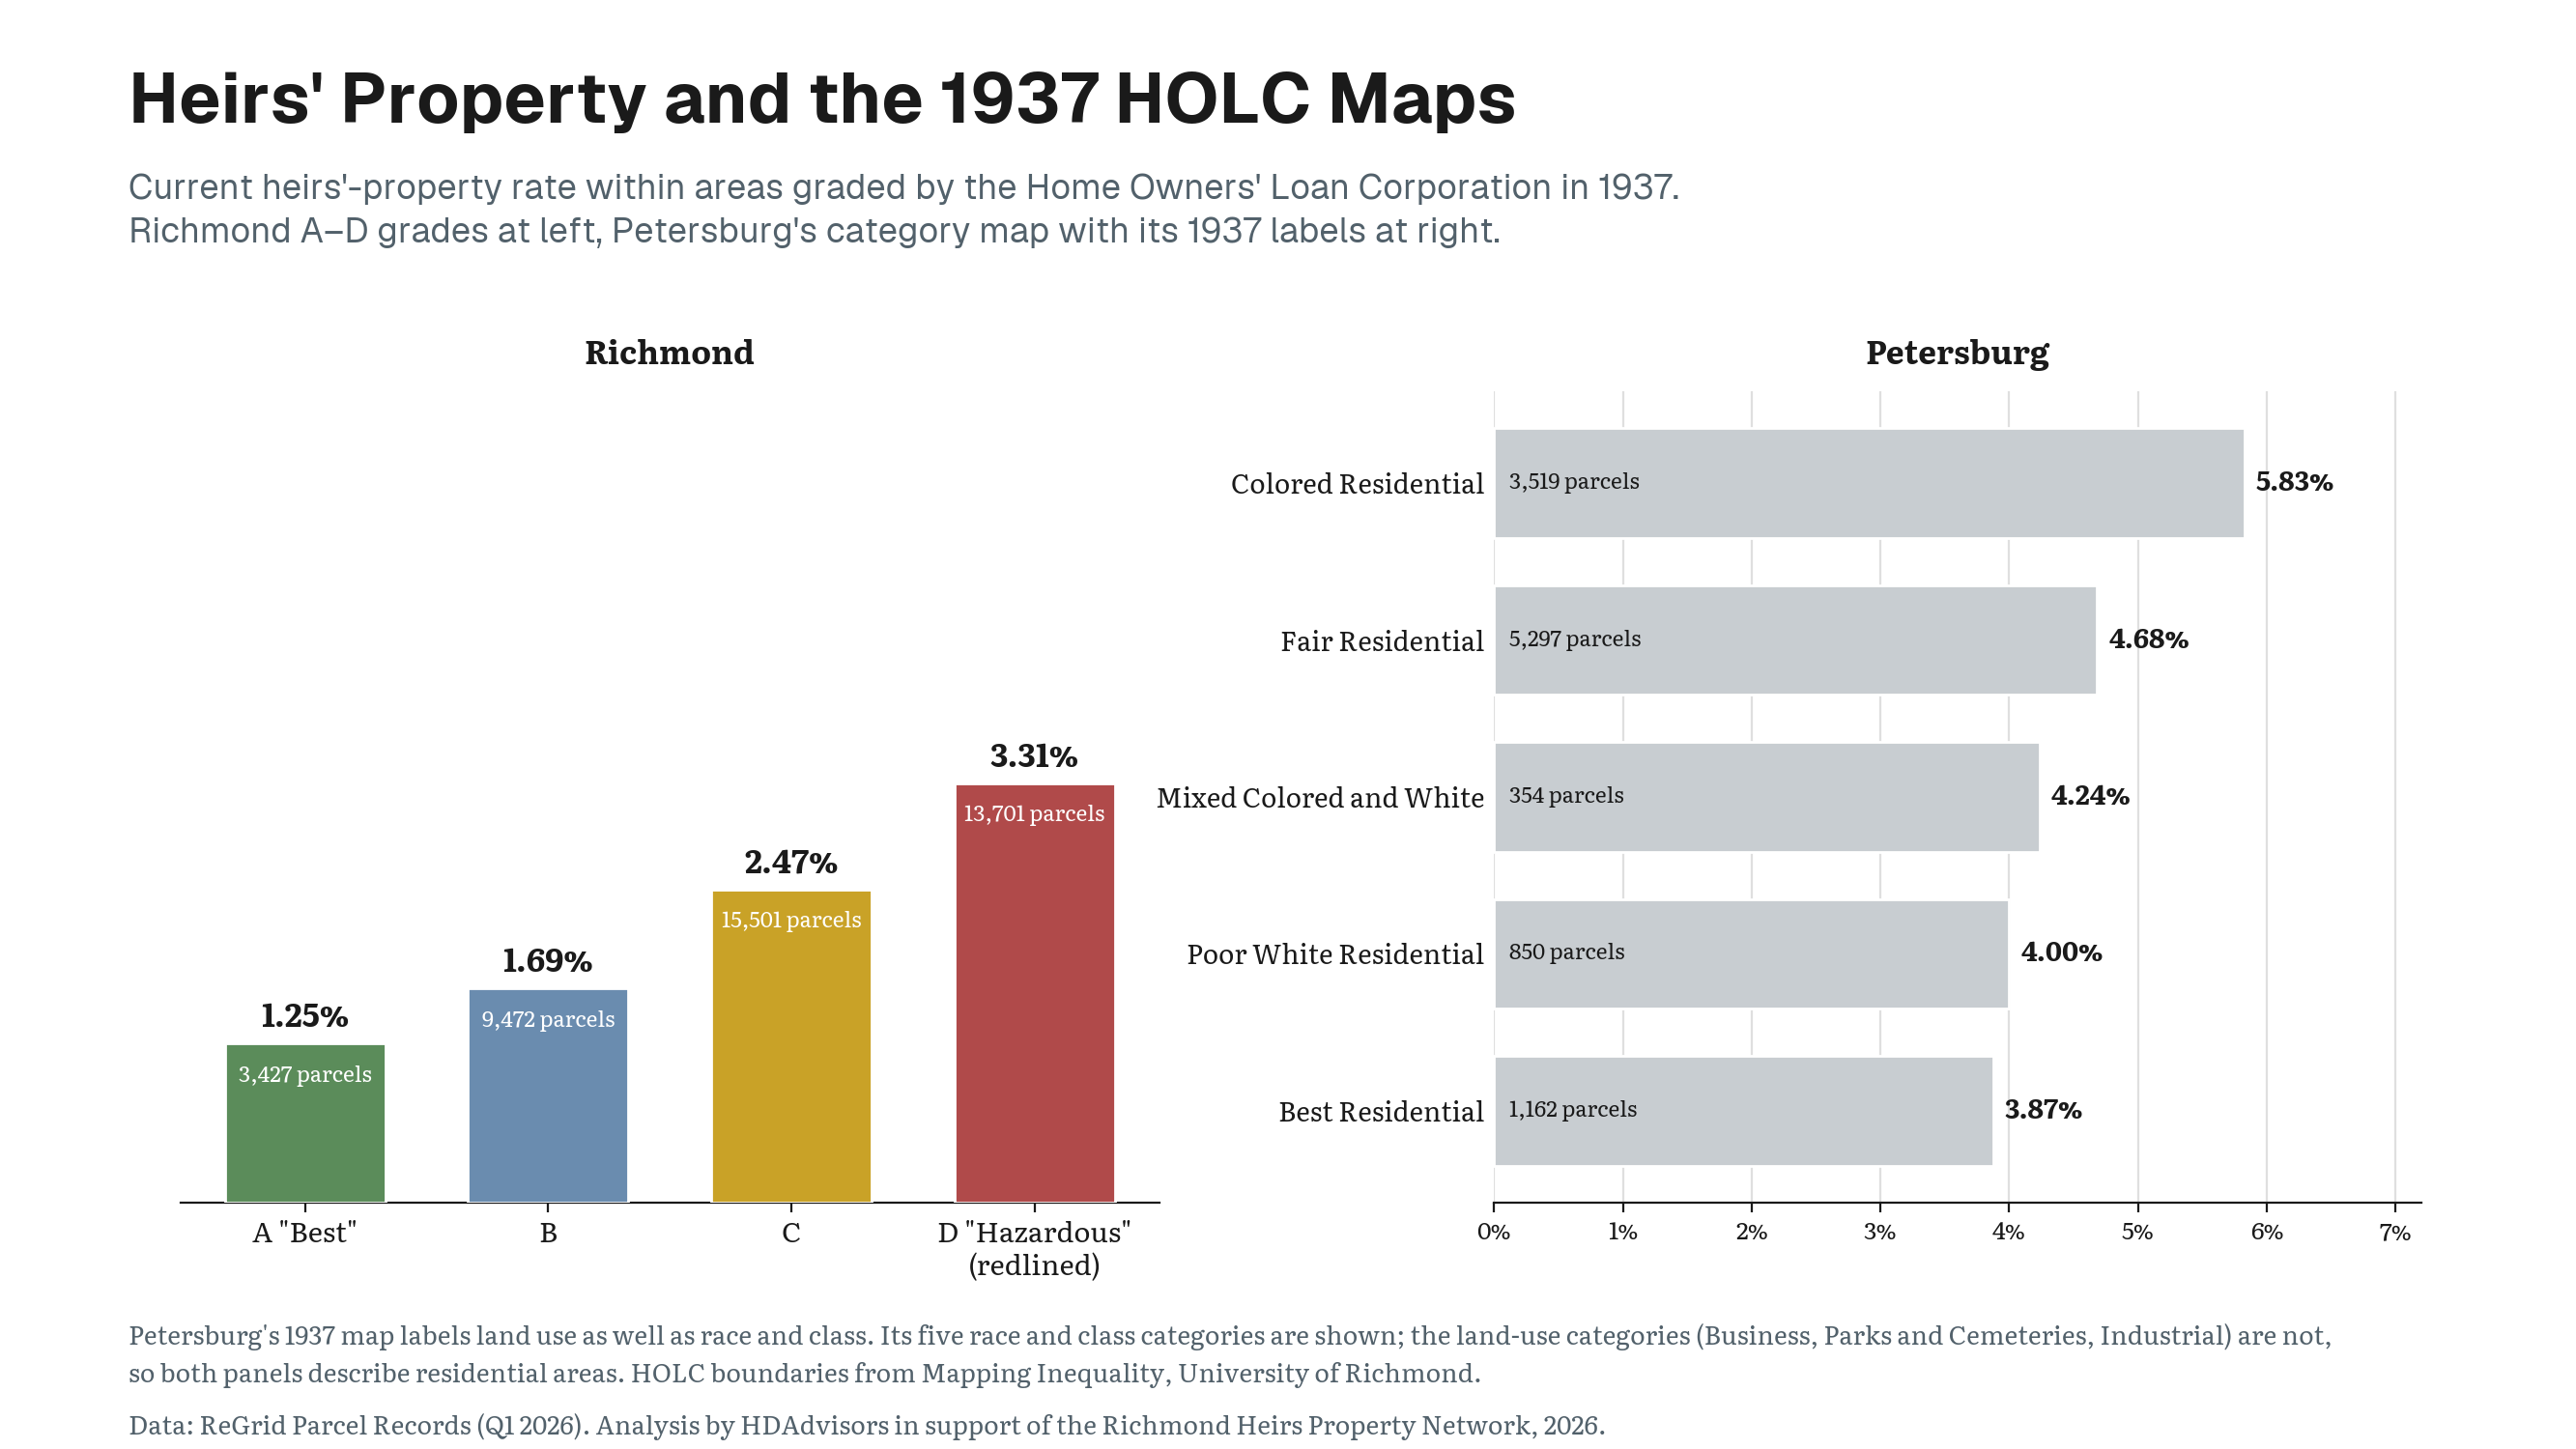
Current heirs’ property rates rise steadily across Richmond’s former HOLC grades:
- 1.25% in areas graded A
- 1.69% in areas graded B
- 2.47% in areas graded C
- 3.31% in areas graded D
The current rate in D-graded areas is more than two and a half times the rate in A-graded areas.
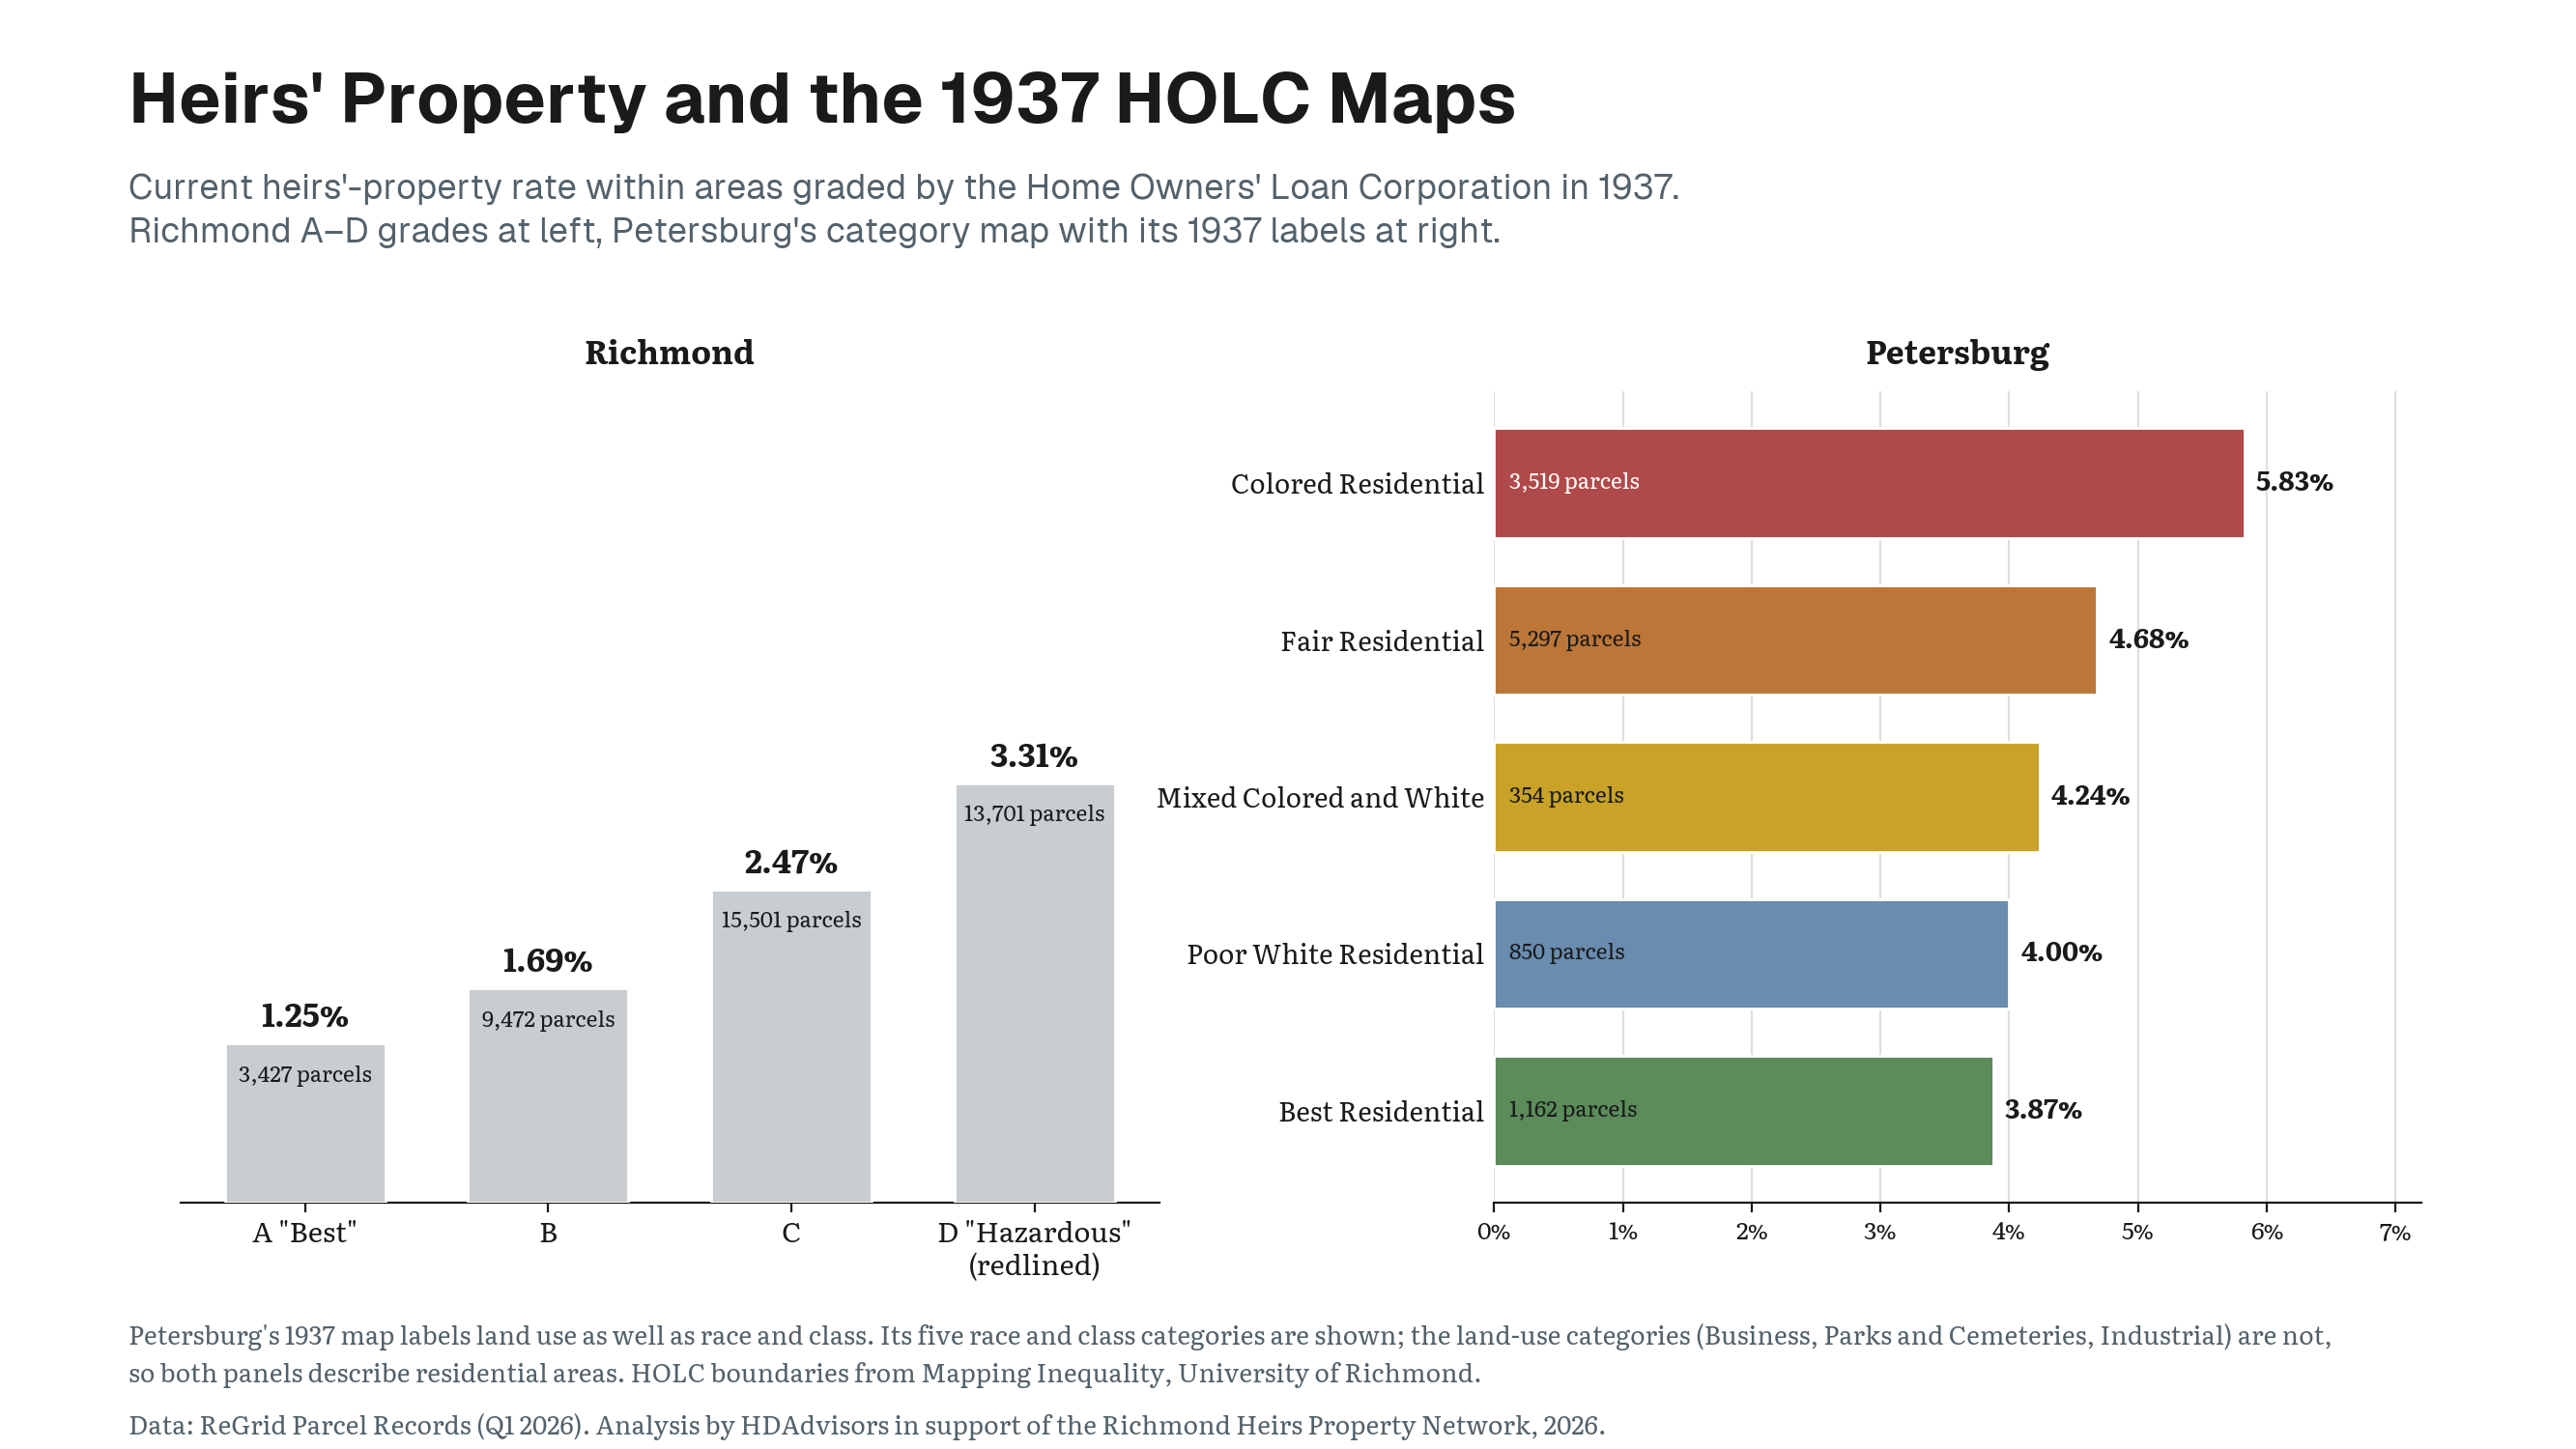
This chart shows that progression on the left.
Petersburg tells a similar story
Petersburg’s 1937 map used racial and land-use descriptions rather than the familiar A-through-D system.
- The area labeled “Colored Residential” now has a flagged-parcel rate of 5.83%.
- The area labeled “Poor White Residential” has a rate of 4.00%.
- The area labeled “Best Residential” has a rate of 3.87%.
The “Poor White Residential” rate is therefore close to the rate in the area labeled “Best Residential,” while the area historically labeled “Colored Residential” has the highest rate of the three.
Takeaway
While the old maps did not create every title problem visible today, nor did they cover the entire region, redlining provides historical context for a broader finding: present-day heirs’ property risk follows a racial geography shaped by generations of unequal access to home ownership, credit, legal assistance, and economic investment.
12. There Is No Single Type of Heirs’ Property
Key Question
Do all flagged heirs’ properties present the same problem and need the same kind of help?
Although the study finds a clear pattern in the geography of heirs’ properties, flagged parcels do not all present the same legal or housing problem.
That matters for a network trying to provide legal assistance. A family living in a long-held home may face a very different problem from a vacant house, an empty lot, or a property whose ownership is already divided among several people.
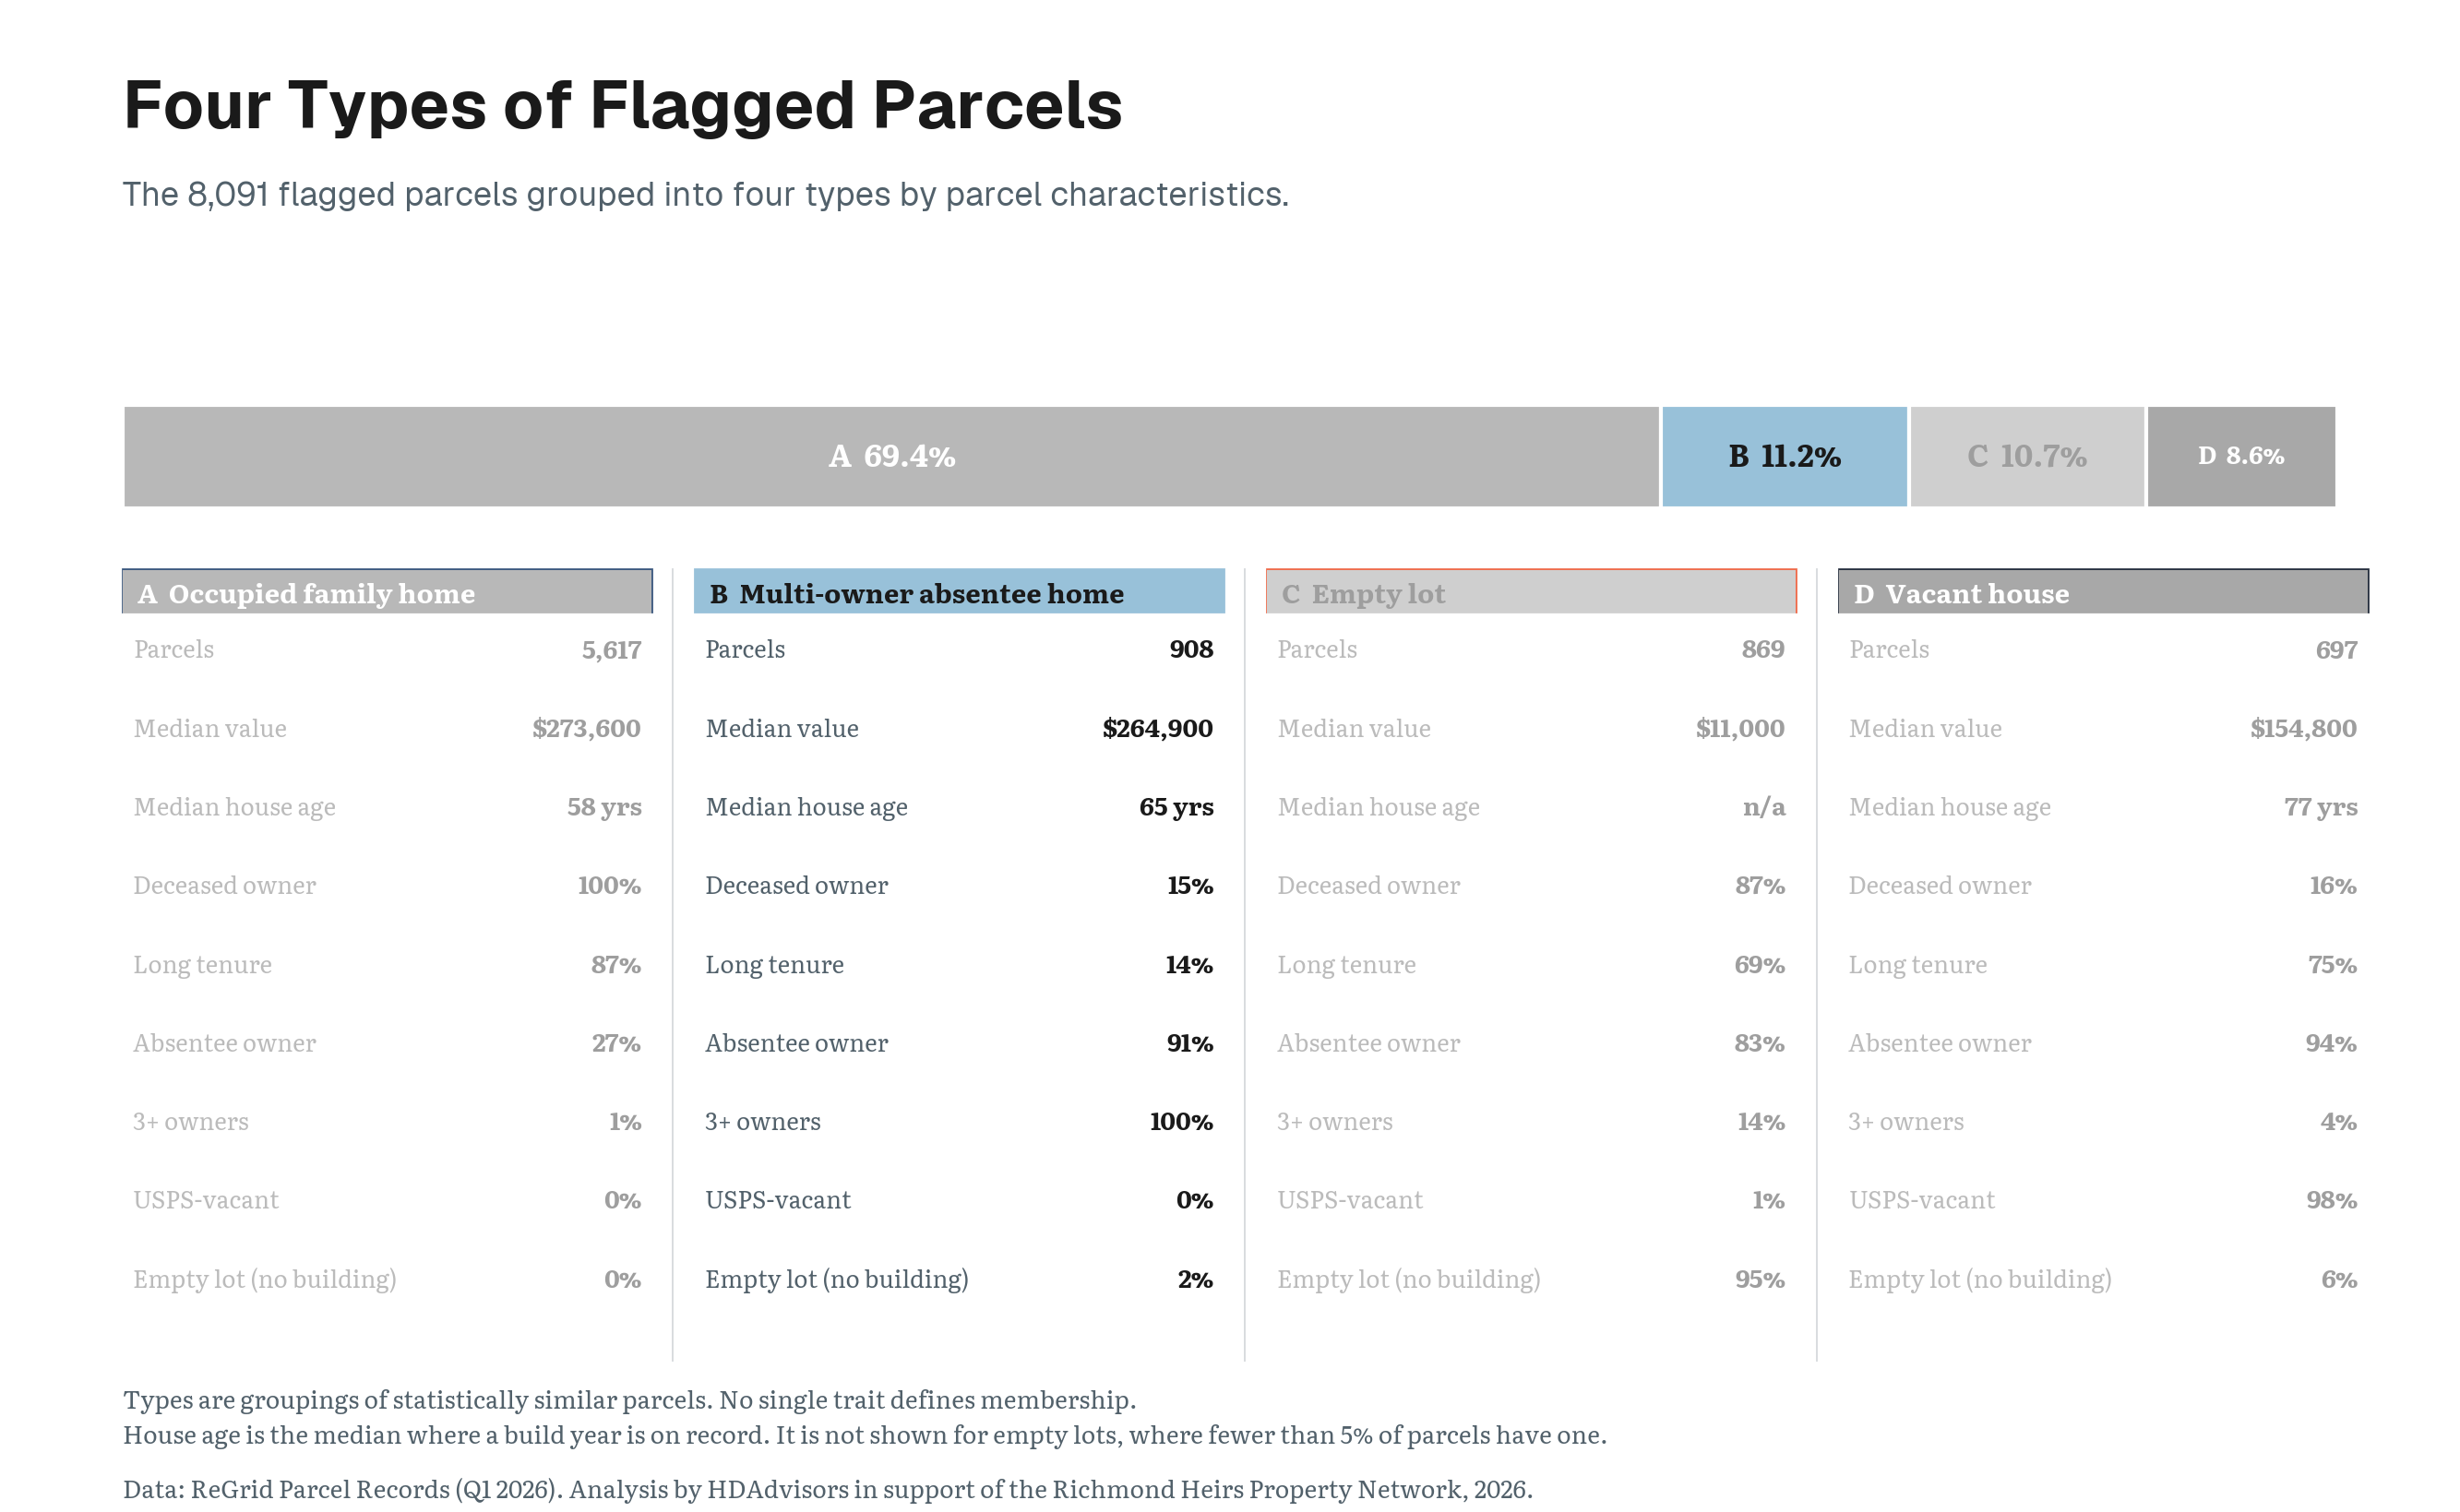
Using only facts recorded about each parcel, rather than neighborhood race, income, or poverty, the study identified four recurring property types.
Key Finding
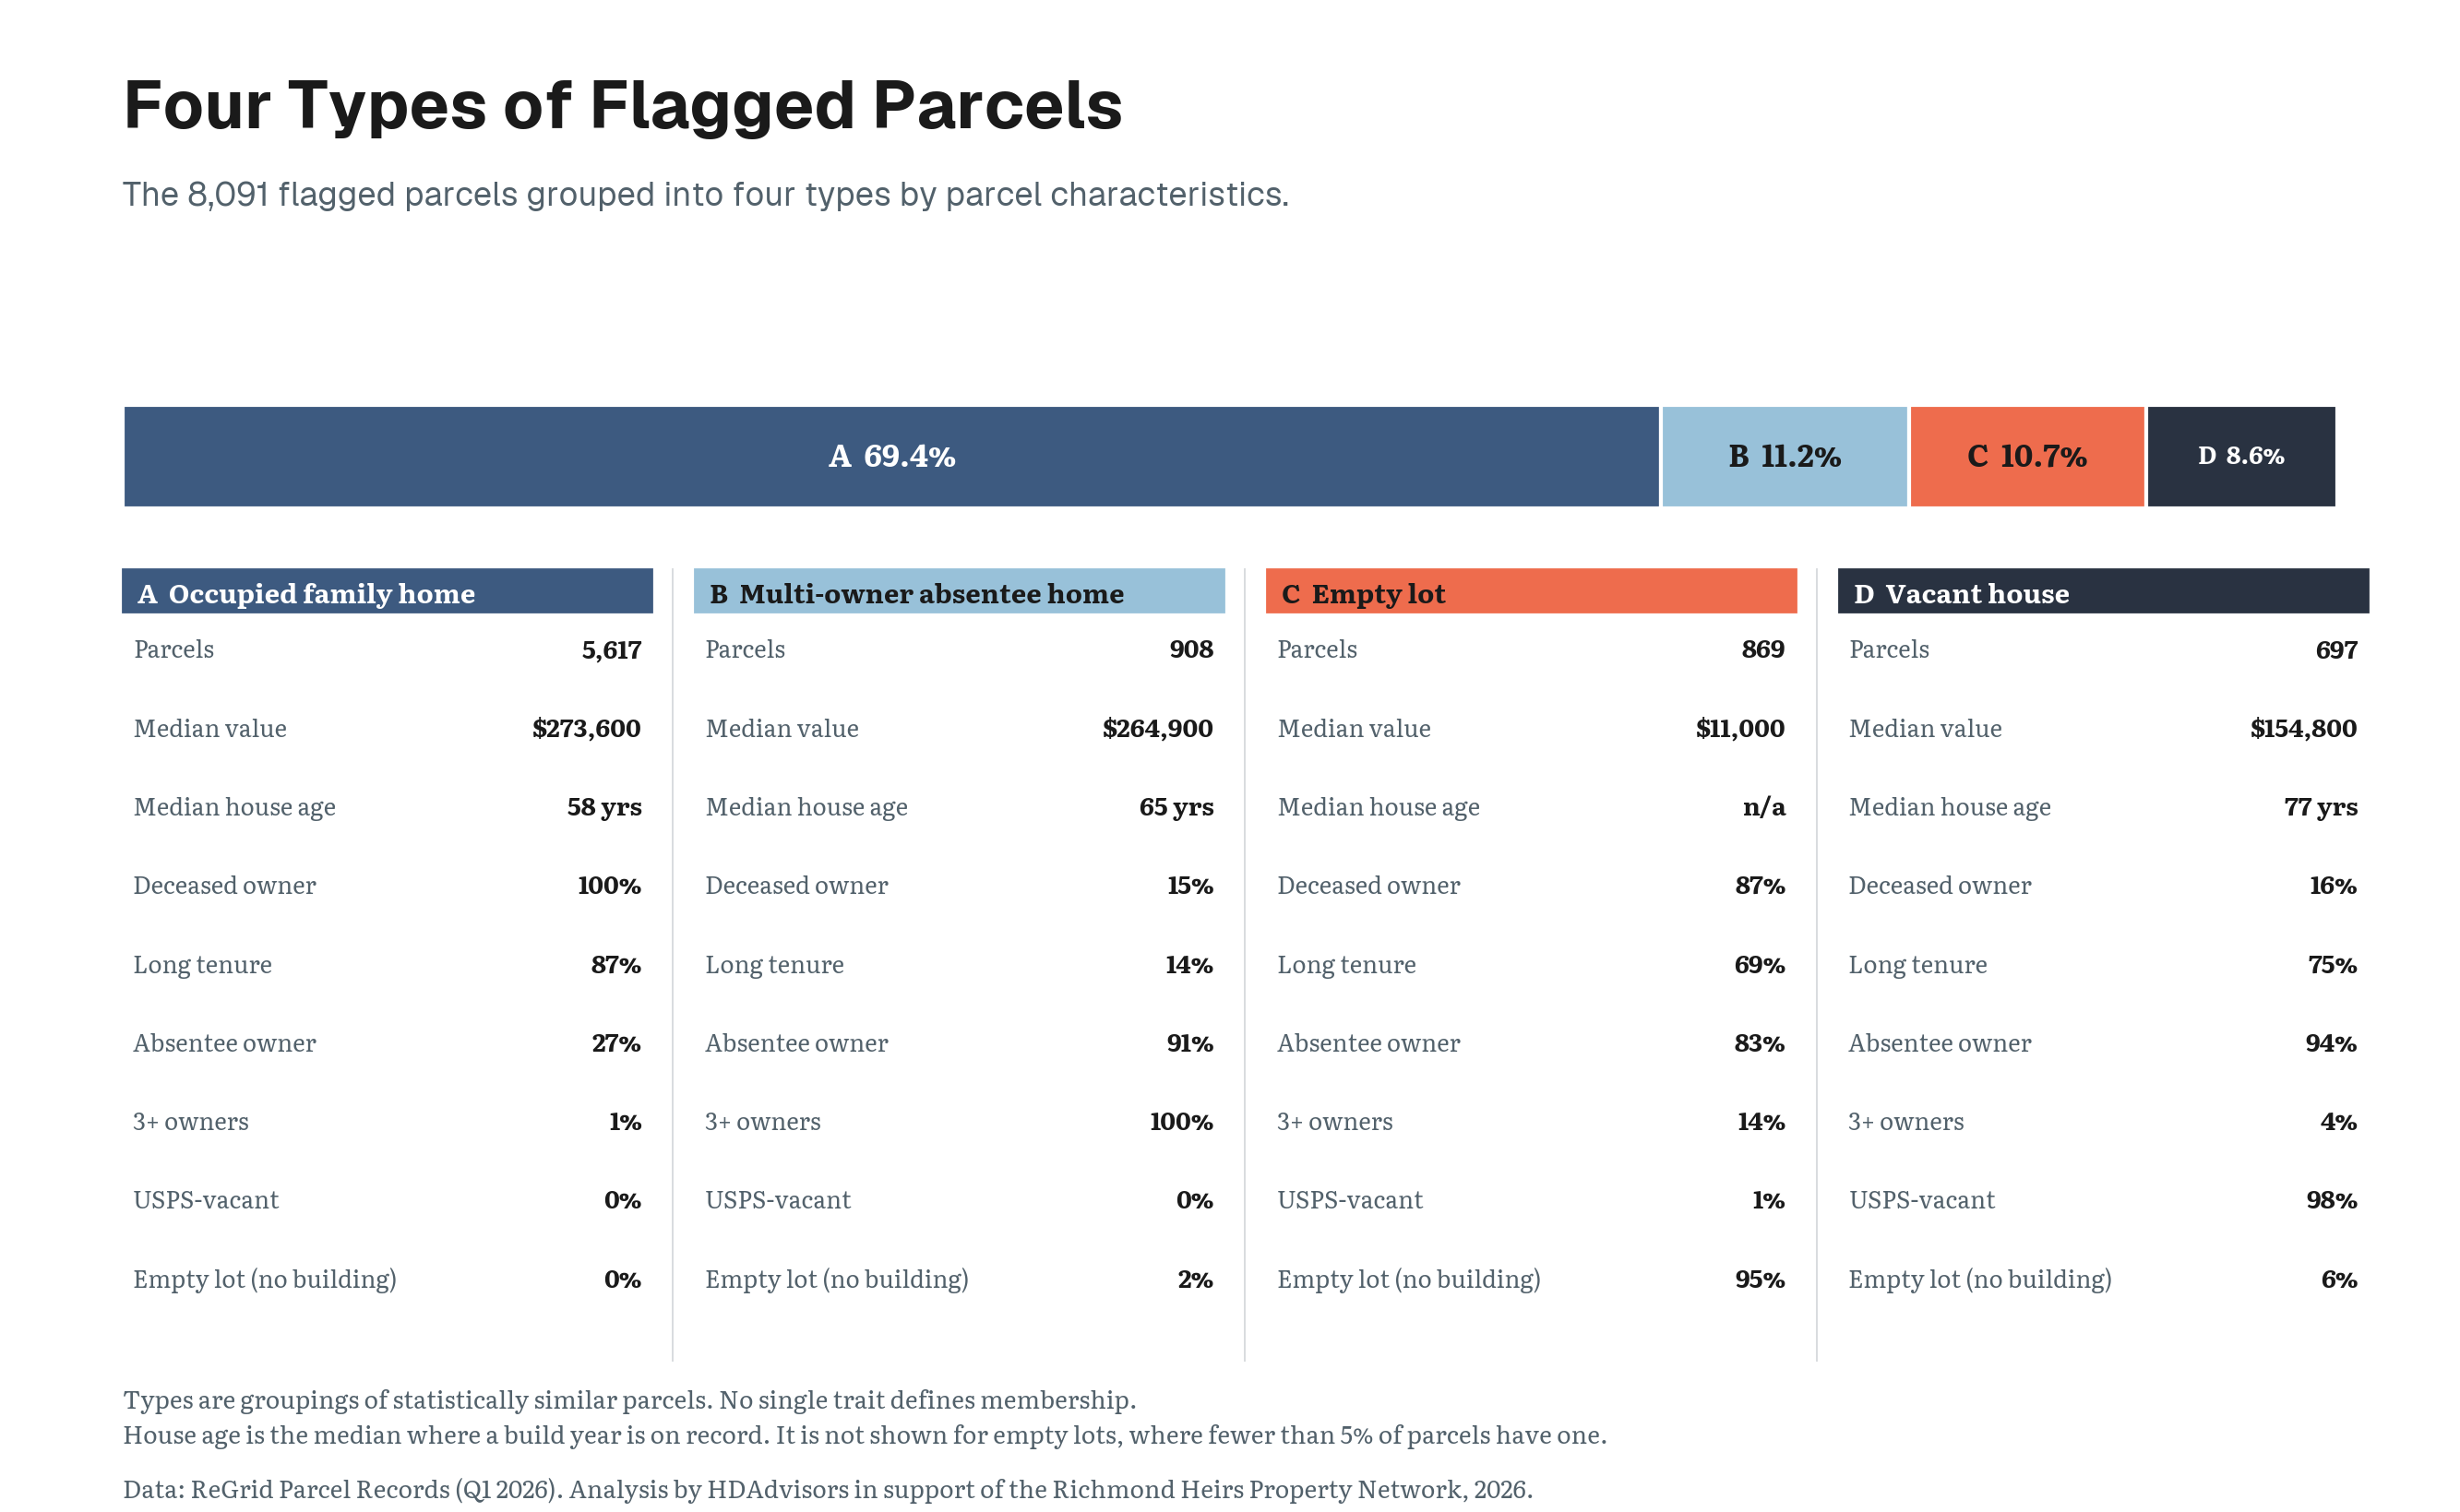
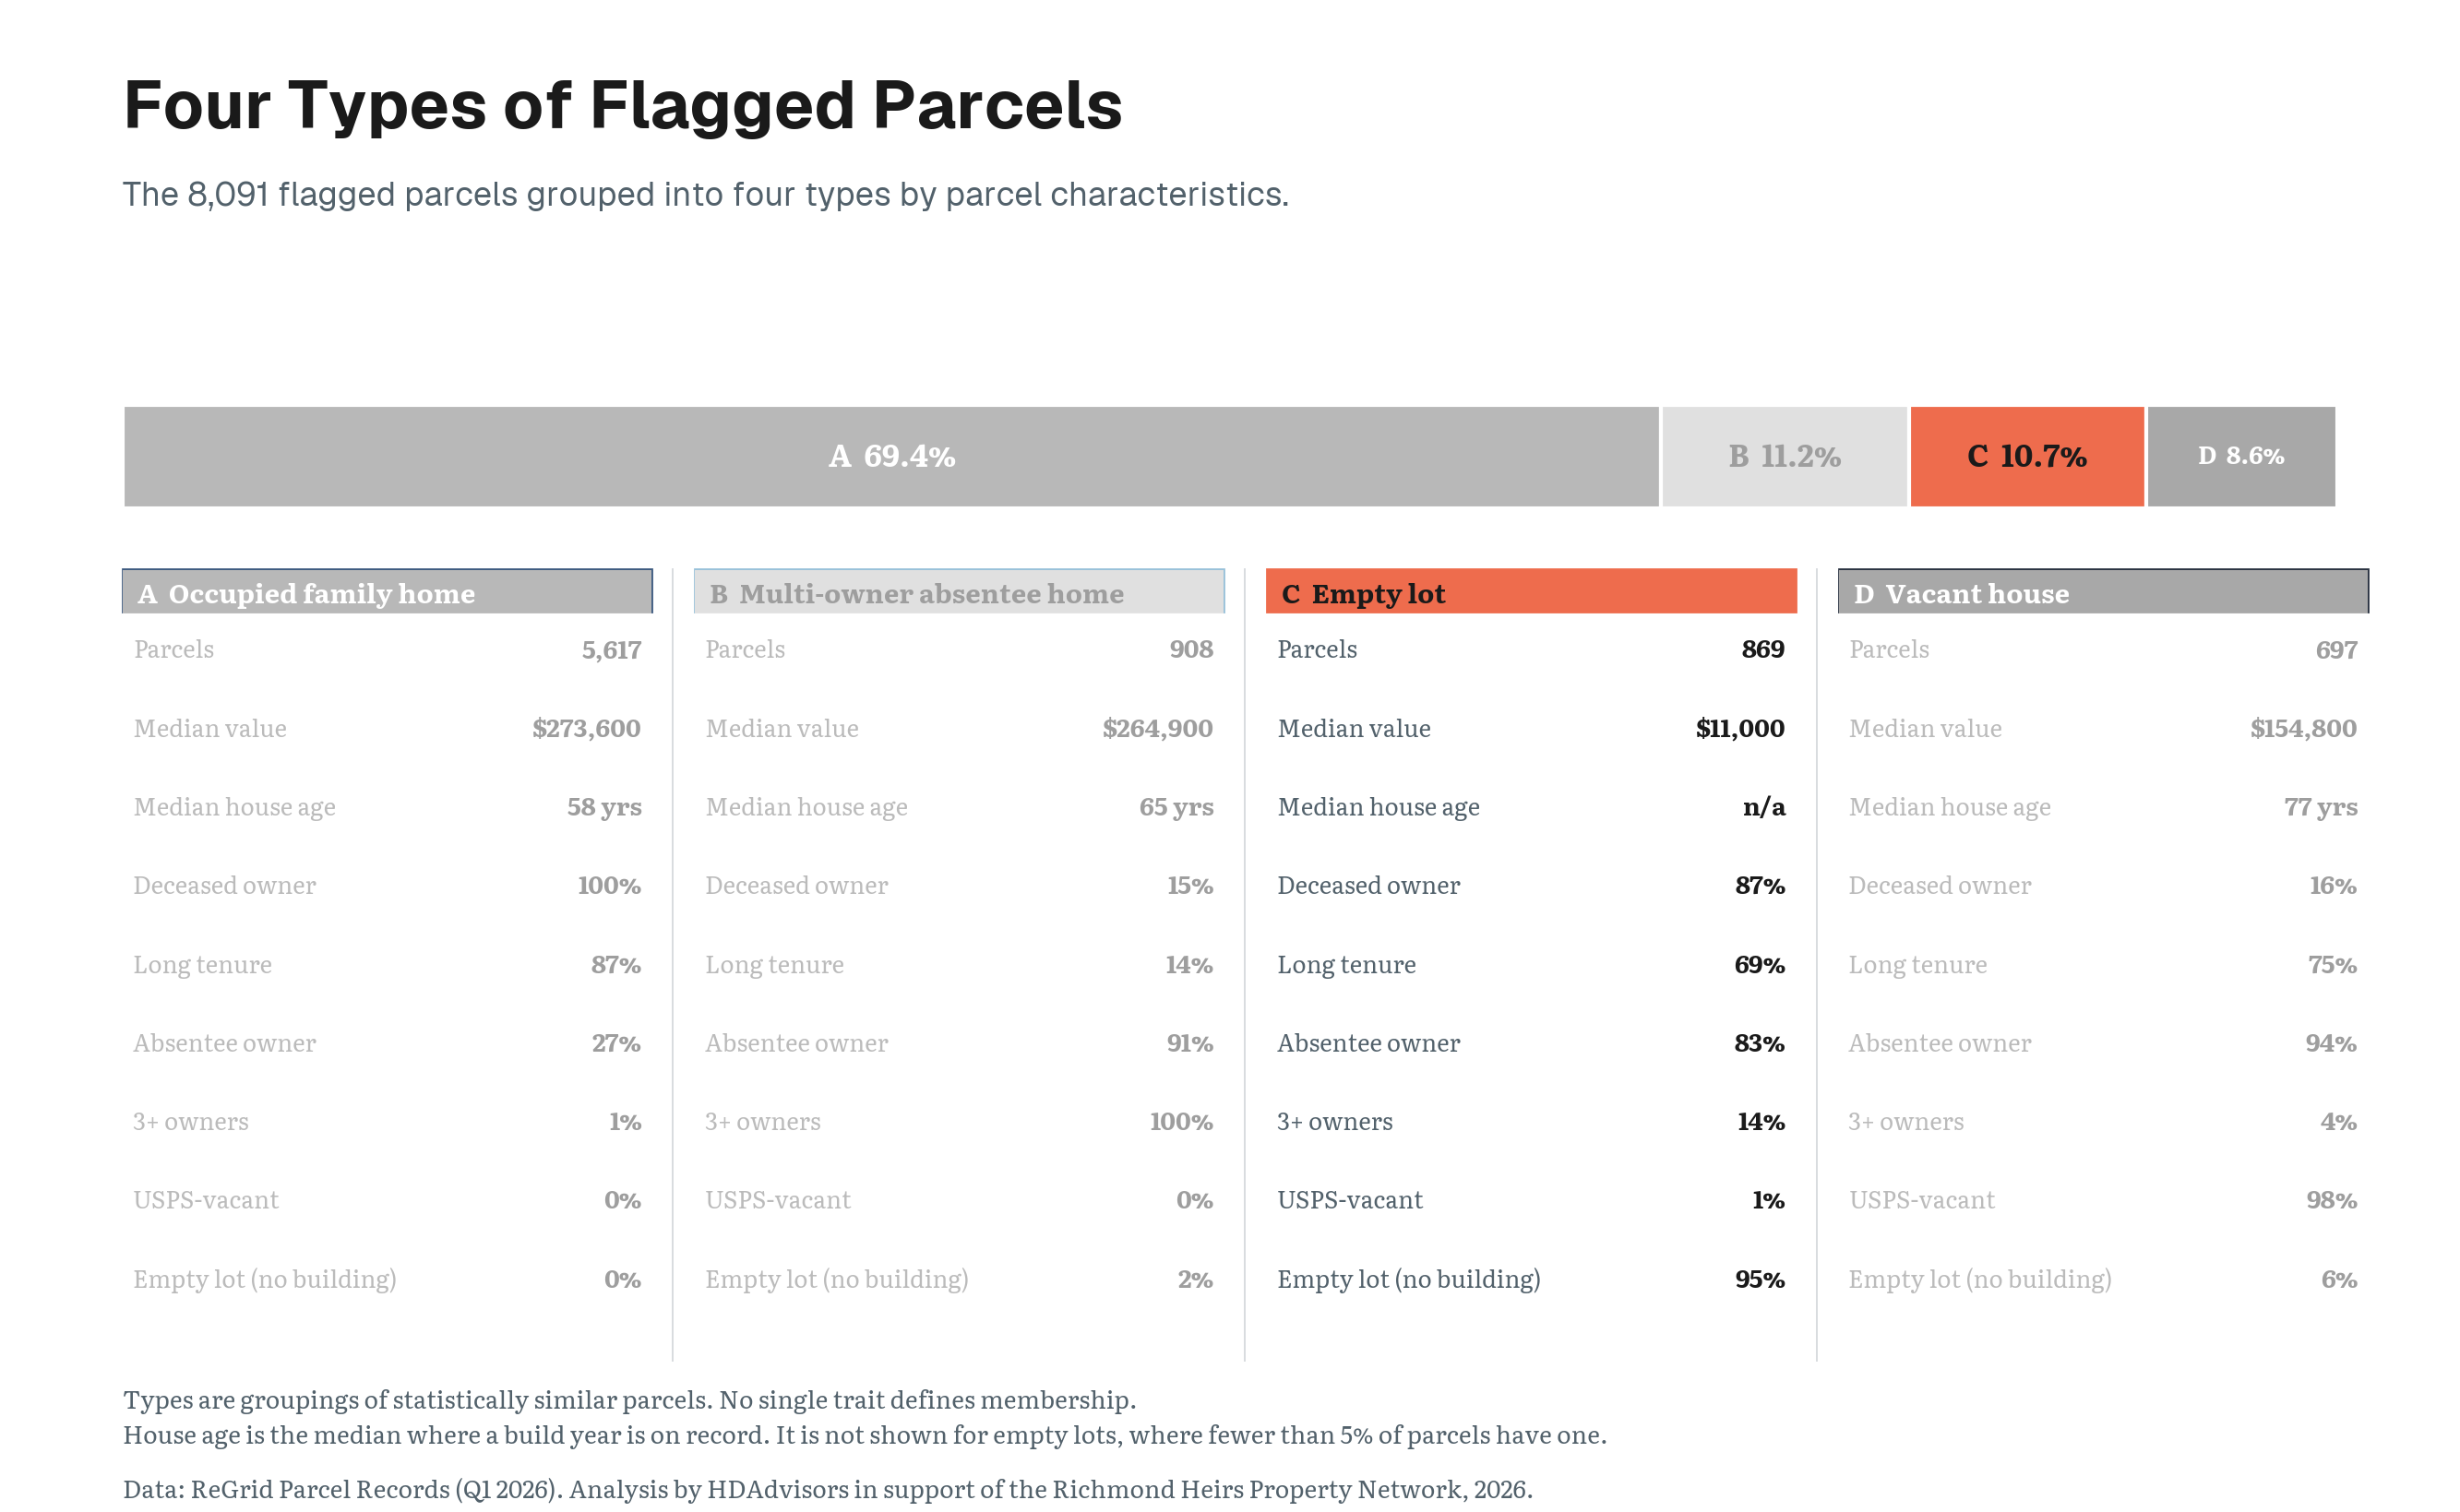
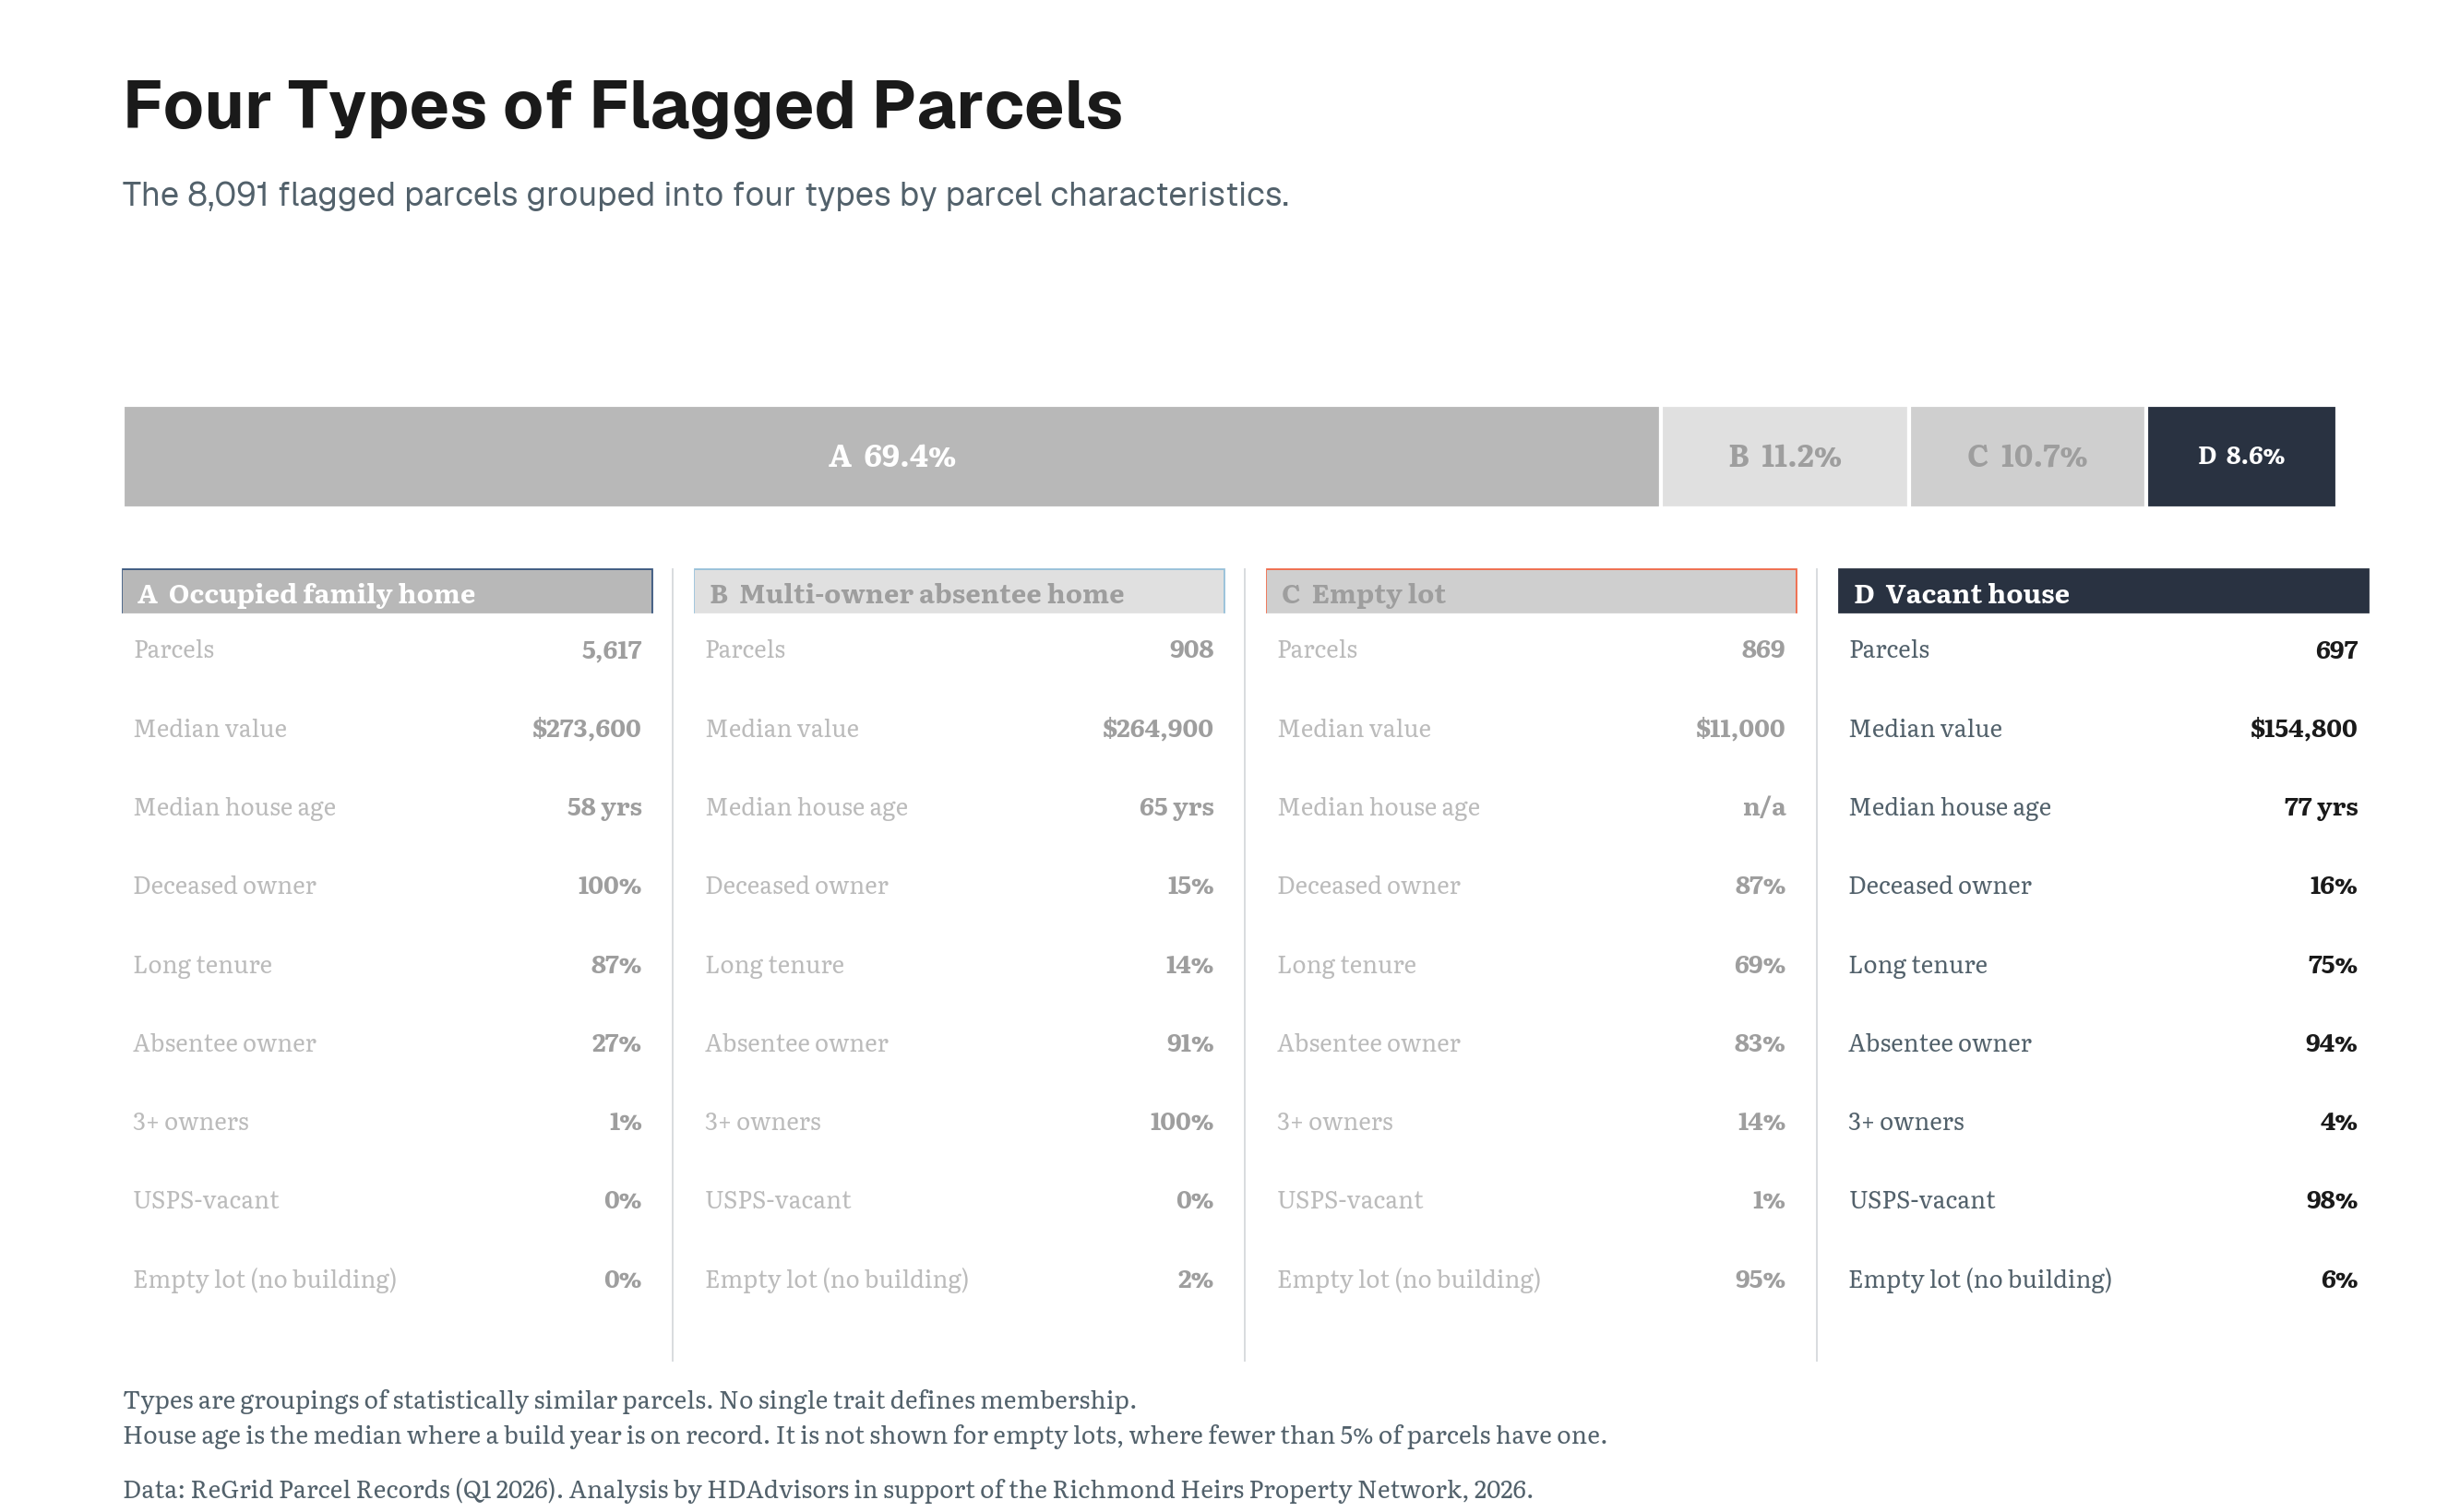
This chart shows the 8,091 flagged parcels grouped into four types based on their property and ownership characteristics.
- 69.4% Occupied family homes
- 11.2% Multi-owner absentee homes
- 10.7% Empty lots
- 8.6% Vacant houses
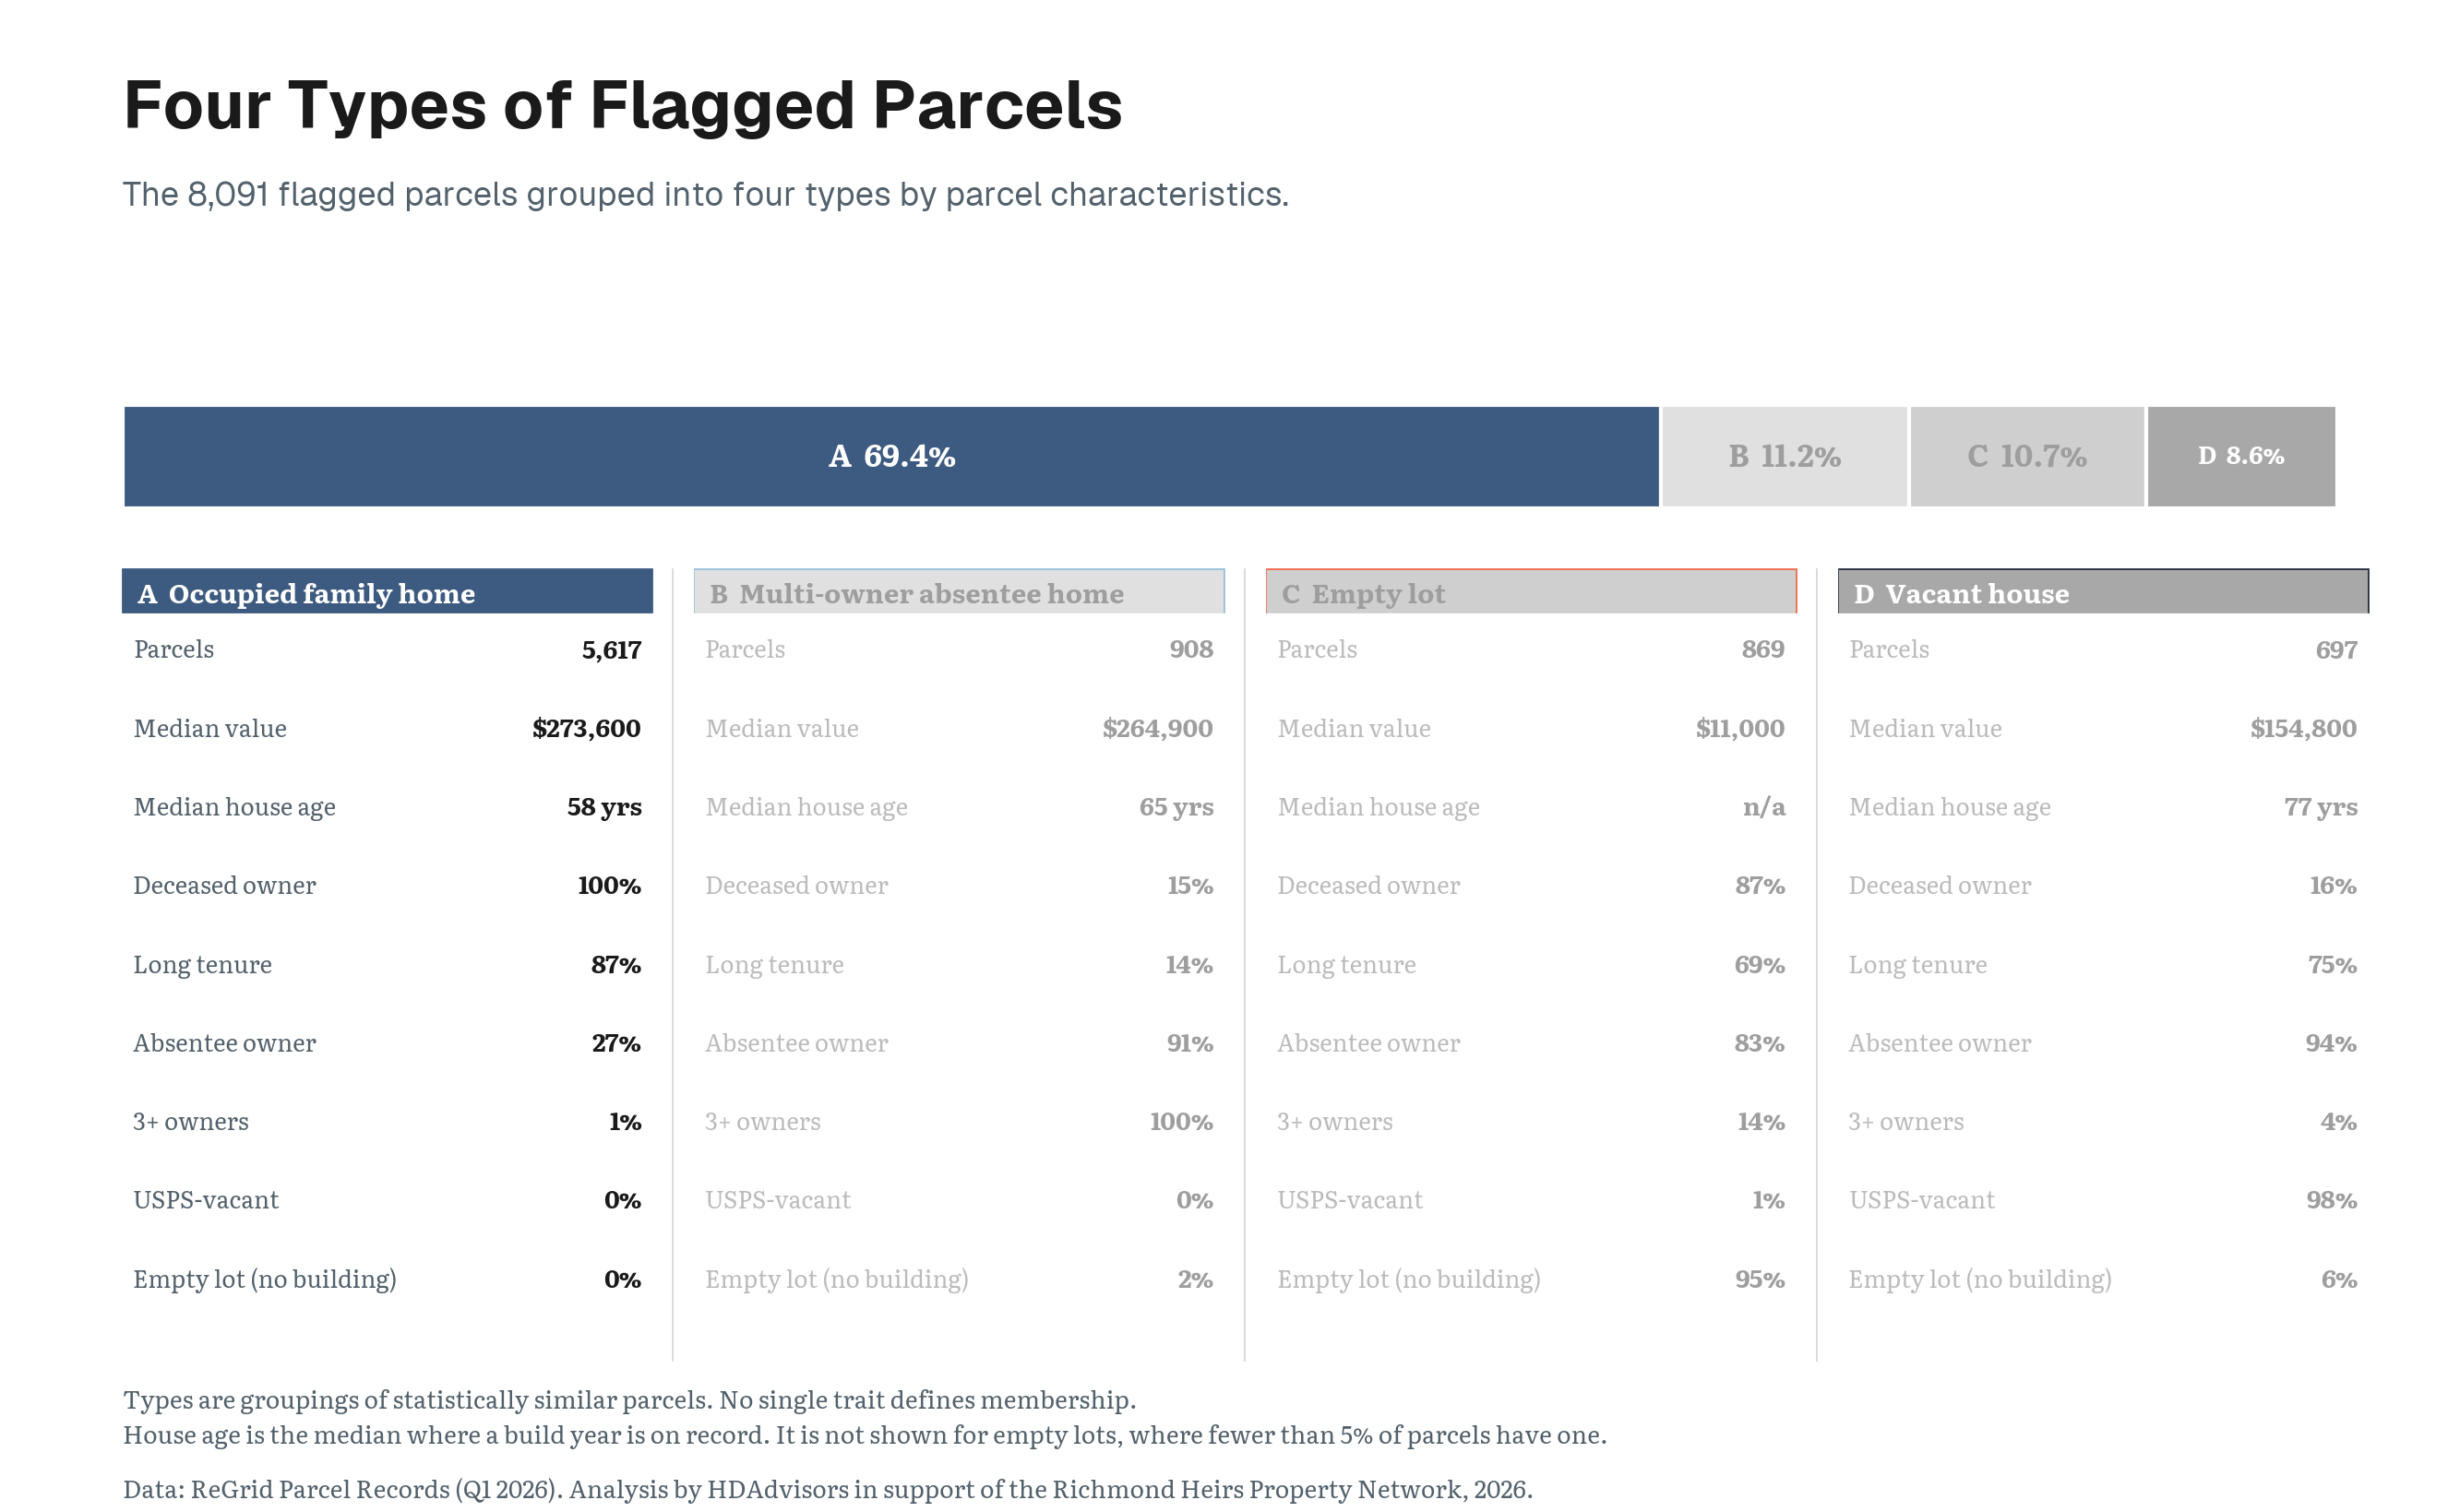
Occupied family homes, 69.4%
Occupied family homes account for 69.4% of all flagged parcels. Every property in this group has a deceased owner of record, most have long tenure, and almost none is marked USPS-vacant.
This is the region’s dominant heirs’ property profile. It is a home that appears to remain in family use while the deed still names someone who has died.
Multi-owner absentee homes, 11.2%
Multi-owner absentee homes account for 11.2%. These properties have at least three owners listed, and nearly all are owned by people whose mailing address differs from the property.
They represent a different risk. Ownership may already be divided among several people who do not live in the home.
Empty lots, 10.7%
Empty lots account for 10.7%. These properties contain no building, but many still have a deceased owner in county records and long ownership tenure.
They may represent inherited land that has remained outside a formally settled estate.
Vacant houses, 8.6%
Vacant houses account for 8.6%. Nearly all are USPS-vacant and absentee-owned.
These homes are the oldest and lowest-valued of the four housing profiles and are disproportionately concentrated in the region’s core hot spots.
Takeaway: Putting This Data to Work
These differences matter because each type may require a different kind of assistance.
A family living in a long-held home may need help probating an estate or clearing title.
A property with several absentee owners may require locating and coordinating multiple heirs.
A vacant house may combine a title problem with more immediate repair, tax, or code-enforcement concerns.10
So the purpose of identifying these types is not simply to describe the region’s heirs’ properties more precisely. It helps distinguish the kinds of problems families and properties may face, so legal assistance and outreach can be better matched to them.
Place matters too
The same distinction also applies to where an heirs’ property is located. The underlying ownership problem may be similar in rural and urban areas, but the property itself and the risks surrounding it can be very different.
Rural heirs’ property may involve larger tracts of farm or undeveloped land that can potentially be divided among owners.
Urban heirs’ property more often involves a house on a small lot, where physical division is impractical and a partition action may instead result in sale and displacement.
In cities, tangled titles may also intersect with pressures such as gentrification and short-term housing speculation, changing how heirs’ property is best understood and addressed.11
Takeaway
There is no single heirs’ property problem, meaning there can be no single heirs' property response. The same underlying title issue can involve an occupied family home, divided ownership among absentee heirs, inherited land, or a vacant house. Each may call for a different combination of legal assistance, outreach, and property support.
13. Different Places Require Different Approaches
Key Question
If heirs’ property looks different from place to place, how can outreach and legal assistance be tailored to local conditions?
Heirs’ property is a regional issue, but it does not look the same everywhere. Different parts of the region contain different mixtures of occupied family homes, multi-owner properties, vacant houses, and inherited land.
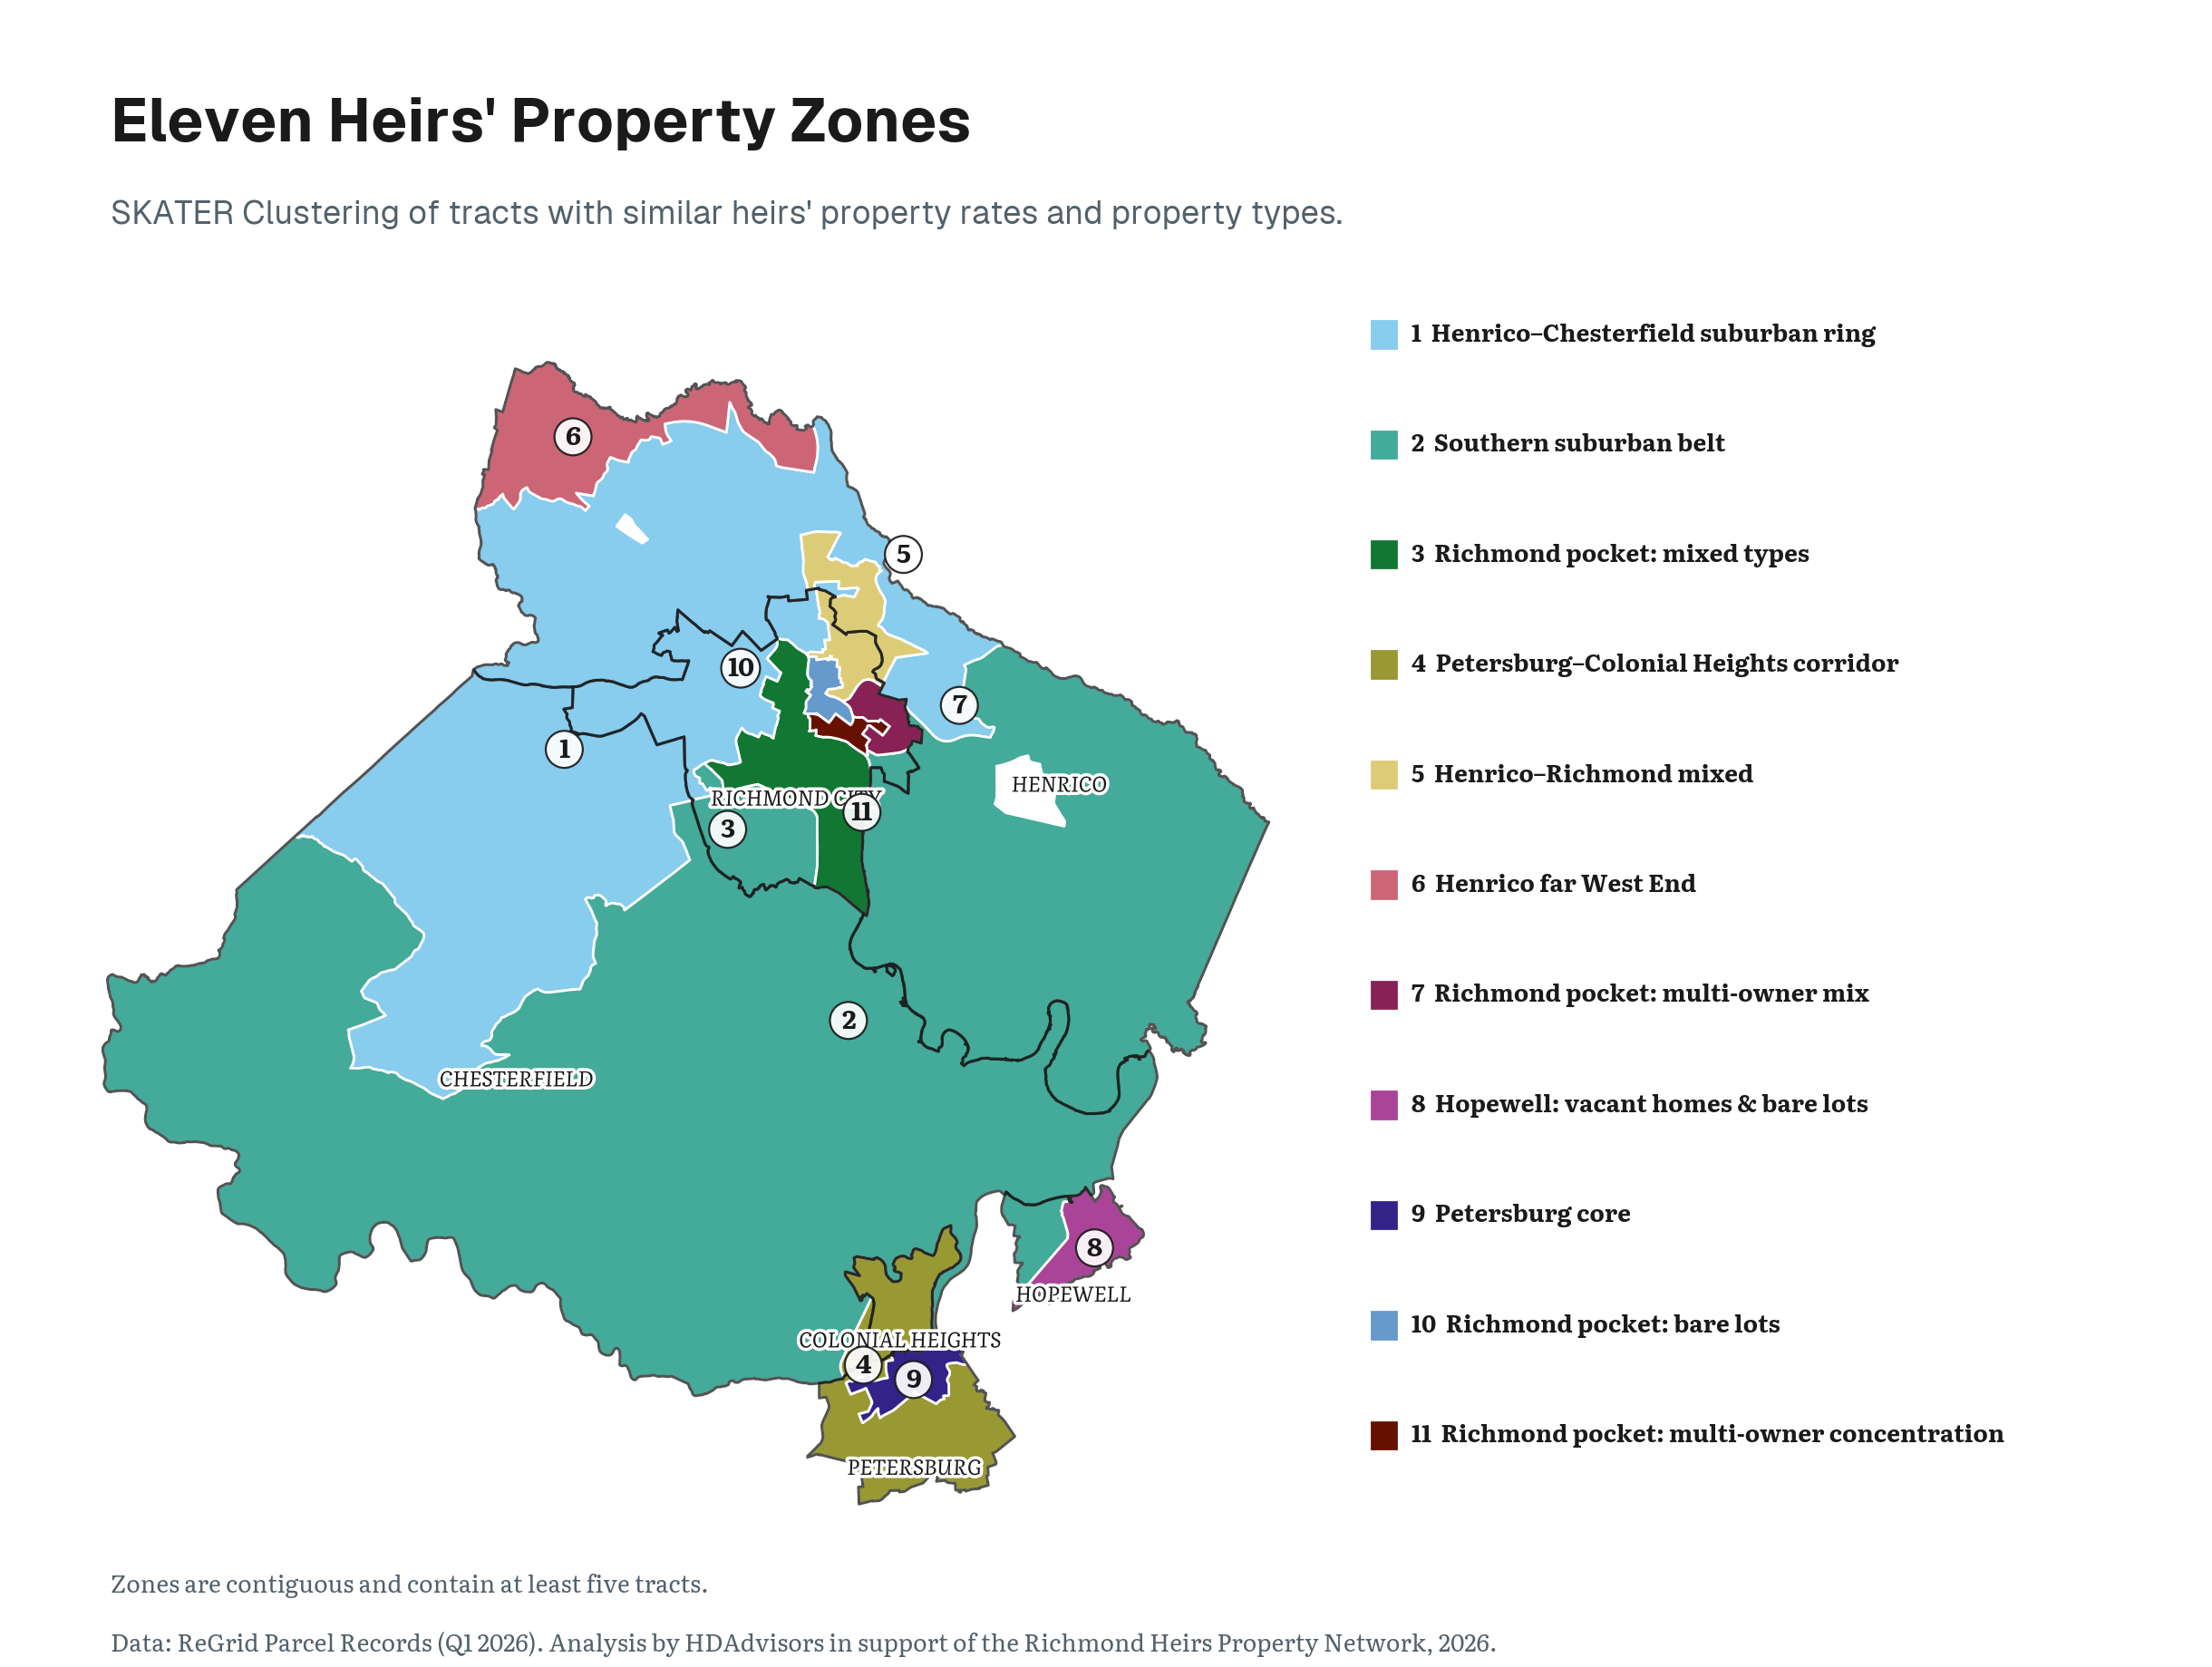
To make those differences easier to understand, the study grouped neighboring census tracts into 11 contiguous zones with relatively similar heirs’ property patterns.
How We Got There
The study created the zones using SKATER, a regionalization method.12 SKATER treats the region as a network in which every tract is linked to the tracts it physically touches. It then cuts the links joining the least similar neighbors, and the groups left standing become the zones.
Because a tract can only be grouped with tracts it touches, each zone forms a single continuous area on the map rather than a scattered collection of look-alike tracts.
Each zone therefore contains neighboring tracts that are relatively similar in both their heirs’ property rates and their mixture of the four property types.
These are analytic zones, not new neighborhoods, political districts, or service boundaries. They simplify a complex regional pattern so that outreach can respond to local conditions.
Key Finding
This map shows the 11 zones and the different heirs’ property profiles that distinguish them across the region.
- The large suburban zones are dominated by occupied family homes and generally have lower rates.
- The Petersburg core and the corridor linking Petersburg and Colonial Heights have some of the region’s highest rates.
- A Hopewell zone contains a larger mixture of vacant houses and empty lots.
- Several smaller Richmond zones stand out for multi-owner properties, bare lots, or mixed property types.
Takeaway: Putting This Data to Work
As with the groupings for properties above, different places may require different kinds of assistance. Building an effective regional network will require a common legal framework, but outreach can also be tailored to respond to the kinds of properties and ownership dilemmas found in each part of the region.
The map is therefore not intended to publicly identify individual families or declare that a particular home has tangled title. It is a guide to accompany where legal education, estate planning, title-clearing assistance, and property-stabilization resources are most likely to be needed.
14. How Do We Identify an Heirs’ Property?
Gathering Signals
With more than 380,000 parcels across the six study areas, identifying heirs’ property at a regional scale is a challenge.
Heirs’ property is difficult to identify from public records alone because courts and assessors do not use a consistent reporting or labeling system nationally—or even across Virginia. A deed may remain in the name of someone who has died, while the family members who inherited an interest in the property never appear in county assessor records. Families often discover the problem only when they try to sell, repair, refinance, or pass on the property.
Combining Signals
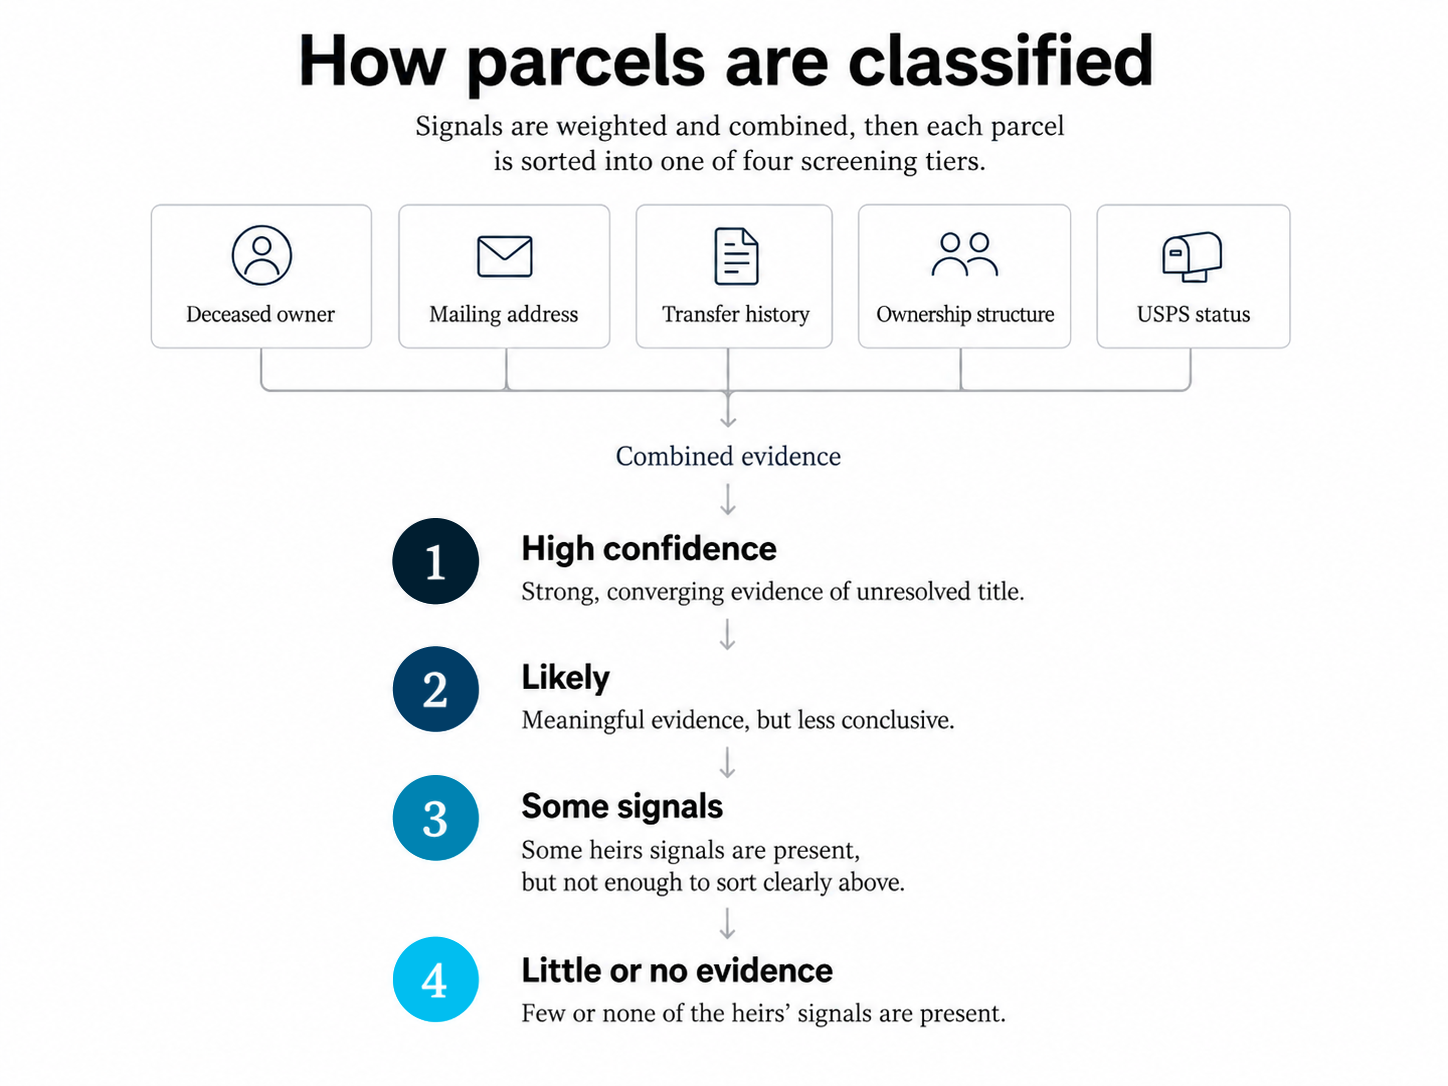
Instead of reviewing each parcel individually, this study developed a weighted screening index to identify parcels showing combinations of indicators commonly associated with heirs’ property.13
Each parcel was screened using a combination of ownership, owner-name, tenure, vacancy, mailing-address, and deceased-owner indicators.
Click an indicator for a short definition.
Ownership
County records list several people, or an estate, as owners of the same parcel. Ownership split across many people is a common result of a property passing to multiple heirs without a settled estate.
Owner name
The name recorded on the deed carries heirs language, such as “estate,” “heirs,” “et al,” or “life estate,” rather than a single living owner. This wording often appears when a property has passed to survivors without the title being formally transferred into their names.
Tenure
The deed has not changed hands for decades. A very long gap since the last recorded transfer can mean the original owner has died and the records were never updated.
Vacancy
The U.S. Postal Service marks an address as vacant when mail has gone undelivered there for an extended period. A home that sits vacant while its deed stays unchanged is a common sign of an unsettled estate.
Mailing address
The owner’s tax bill is mailed to an address different from the property itself. After an owner dies, bills often go to a relative who lives elsewhere while the property stays in the deceased owner’s name.
Deceased owner
Public records indicate that the person named on the deed has died. This is the strongest single indicator, because it means the property may never have been formally passed on to the heirs.
Those signals were then weighted and combined to distinguish parcels with stronger evidence of unresolved title from those with less conclusive patterns.
From Signals to Classification
Parcels were placed into four tiers based on the strength of that evidence:
- High confidence. Stronger, converging evidence of unresolved title.
- Likely. Meaningful but less conclusive evidence.
- Some heirs’ signals present. Some indicators are present, but not enough appear together to place the parcel clearly in either tier above.
- None of the heirs’ signals present. Few or none of the indicators are present. Most parcels fall into this tier and show no meaningful evidence of an unresolved estate.
These tiers are classifications built from the indicators above, not definitive determinations of heirs’ status.
The result is a regional screen identifying parcels with an elevated risk of being heirs’ property. More details about the screening methodology are available on the Methods & Data page.
15. About This Study
This study was commissioned by Local Initiatives Support Corporation of Virginia, with funding from JPMorganChase, for HDAdvisors, which operates the Richmond Heirs Property Network (RHPN) pilot, to give the region its first parcel-level picture of heirs’ property. RHPN connects families with free legal assistance to resolve and prevent heirs’ property, helping stabilize housing and increase access to intergenerational wealth. This work relies on the generosity and partnership of many who draft wills, probate estates, and clear ownership records. The findings here are intended to direct that outreach and inform policy in the neighborhoods where unresolved title is most concentrated.
The use of this data or any research herein to further real estate speculation on heirs’ property is explicitly prohibited. The views and opinions stated in this report are LISC's and not of organizations supporting the work
Made possible by contributions from LISC Virginia in support of HDAdvisors and the Richmond Heirs Property Network.
Organizations behind this study



Tracts with fewer than 5 heirs-flagged parcels or fewer than 100 total parcels are not assigned a rate class.
Footnotes
Heirs’ property is a form of tenancy in common, in which each heir holds an undivided fractional interest in the whole property rather than title to a specific part of it. G. Rebecca Dobbs and Cassandra Johnson Gaither, “How Much Heirs’ Property Is There? Using LightBox Data to Estimate Heirs’ Property Extent in the United States,” Journal of Rural Social Sciences 38, no. 1 (2023).↩︎
Cassandra Johnson Gaither and Stanley J. Zarnoch, “Unearthing ‘dead capital’: Heirs’ property prediction in two U.S. southern counties,” Land Use Policy 67 (2017): 367–377, https://doi.org/10.1016/j.landusepol.2017.05.009.↩︎
Local Initiatives Support Corporation, “Heirs’ Property,” https://www.lisc.org/our-initiatives/affordable-housing/heirs-property; and Kurt W. Smith and Ryan Thomson, “Property estimation, landowner perspectives and timber valuation of heirs property in North Carolina,” Trees, Forests and People 18 (December 2024): 100716, and the published corrigendum to that article.↩︎
Total assessed value is calculated from parcels with positive assessed values after accounting for multi-lot parcel groups. Assessed value should not be interpreted as market value, homeowner equity, or value lost.↩︎
Vacancy is the share of parcels with a known USPS vacancy status. Parcels with no status on record are excluded from the denominator. Across the study area, most parcels without a recorded status are lots without buildings, which often lack a deliverable address.↩︎
Earlier heirs’ property research has likewise found geographic concentration at parcel and county scales. See Cassandra Y. Johnson Gaither, “Spatial Dimensions of Heirs’ Property in Maverick County, TX,” Southeastern Geographer 57, no. 4 (2017): 371–387; and Ayoung Kim, John Green, Cassandra Johnson-Gaither, and G. Rebecca Dobbs, “Analyzing Heirs’ Property Prevalence and Spillover Effects in the U.S. Using Spatial Econometric Analysis,” Agricultural and Resource Economics Review 54, no. 3 (2025): 596–616, https://doi.org/10.1017/age.2025.10016.↩︎
B. James Deaton, “Land ‘in Heirs’: Building a Hypothesis Concerning Tenancy in Common and the Persistence of Poverty in Central Appalachia,” Journal of Appalachian Studies 11, no. 1/2 (2005): 83–94; and B. James Deaton, “Intestate Succession and Heir Property: Implications for Future Research on the Persistence of Poverty in Central Appalachia,” Journal of Economic Issues 41, no. 4 (2007): 927–942.↩︎
A local model estimated the relationship separately across the region. The association was significantly positive in 209 of 256 tracts and negative in none.↩︎
Sarah Stein and Ann Carpenter, “Heirs’ Property in an Urban Context” (2022). Using the Jacksonville, Florida, area as a case study, Stein and Carpenter found that urban heirs’ properties tend to sit in lower-income, low-wealth, lower-educational-attainment, and racial and ethnic minority communities; that a higher Black population share was significantly associated with higher heirs’ property concentration; and that heirs’ property concentrations overlap substantially with historically redlined areas.↩︎
B. James Deaton and Jamie Baxter, “Towards a Better Understanding of the Experience of Heirs on Heirs’ Property,” in Heirs’ Property and Land Fractionation: Fostering Stable Ownership to Prevent Land Loss and Abandonment, ed. Cassandra J. Gaither, Ann Carpenter, Tracy Lloyd McCurty, and Sara Toering, Gen. Tech. Rep. SRS-244 (Asheville, NC: U.S. Department of Agriculture Forest Service, Southern Research Station, 2019), 44–48.↩︎
Codi Royall, “From Great Migration to Gentrification: Heirs Property in the Urban Context,” Northern Illinois University Law Review 45, no. 2 (2025): 246.↩︎
Renato M. Assunção, Marcos Corrêa Neves, Gilberto Câmara, and Corina da Costa Freitas, “Efficient Regionalization Techniques for Socio-Economic Geographical Units Using Minimum Spanning Trees,” International Journal of Geographical Information Science 20, no. 7 (2006): 797–811, https://doi.org/10.1080/13658810600665111. The zones were built with the SKATER implementation in spopt 0.7.0. Xin Feng et al., “spopt: A Python Package for Solving Spatial Optimization Problems in PySAL,” Journal of Open Source Software 7, no. 74 (2022): 3330, https://doi.org/10.21105/joss.03330.↩︎
Ryan Thomson and Conner Bailey, “Identifying Heirs’ Property: Extent and Value Across the South and Appalachia,” Journal of Rural Social Sciences 38, no. 1 (2023): 29–38, https://doi.org/10.34068/jrss.38.01.05. Thomson and Bailey developed a weighted four-variable index built from property-tax records to estimate the likelihood that an individual parcel is heirs’ property. The screen used here follows that summative approach and adds direct deceased-owner matching, vacancy, and confidence tiers, as described on the Methods & Data page.↩︎